

Most bike shops price services by copying competitors or adding a percentage to last year's rates. Both approaches completely ignore what actually drives profitability in bike service: the relationship between labor time, parts markup, and overhead allocation per mechanic.
A shop owner showed me their pricing spreadsheet last month. Basic tune-up at $65, major overhaul at $195. Seemed reasonable until we plugged in their actual costs. They were losing $11 on every tune-up after factoring in true overhead. The overhaul barely broke even when a tech took longer than 90 minutes.
The problem wasn't their prices being too low. The problem was they had no system to understand what each service actually costs to deliver.
Where bike shop service pricing breaks
Service pricing in bike shops fails at three specific points. Each one compounds the others, creating a margin squeeze that gets worse as volume increases.
Time estimates drift from reality. A tune-up might take your experienced tech 35 minutes. Your newer tech needs 55 minutes. Your pricing assumes 45 minutes. Nobody tracks actual times, so the disconnect grows wider each season. When labor is 60-70% of service cost, a 20-minute variance destroys margins.
Parts markup gets applied uniformly. Shops typically mark up all parts 50-100%. But a $3 cable should carry different markup than a $45 cassette when both go into the same overhaul. The labor component stays fixed while parts costs vary wildly between similar services. Standard markup formulas can't handle this variance.
Overhead allocation ignores utilization patterns. Most shops divide monthly overhead by total labor hours to get an hourly burden rate. Sounds logical until you realize your tune-up tech works at 85% utilization while your overhaul specialist hits 65% because of longer job cycles and more complex diagnostics. Same overhead rate, completely different cost structures.
These factors create a hidden loss pattern. High-volume, quick services subsidize complex repairs. Experienced techs generate profit while newer techs operate at losses on the same jobs. The shop looks profitable overall while specific services bleed money.
Building time-and-motion baselines that actually work
Real time tracking starts with breaking services into components, not treating them as black boxes. A basic tune-up isn't one 45-minute block. It's inspection (8 minutes), derailleur adjustment (12 minutes), brake adjustment (10 minutes), wheel true (8 minutes), lubrication (5 minutes), test ride (7 minutes).
Never miss a sale or service appointment again.
Bicyclly helps you manage every sale, repair, and booking with ease and accuracy.
- Unified inventory and sales tracking
- Automated customer notifications
- Service appointment scheduling
No credit card required
Track each component separately for two weeks. Use a simple grid where techs mark actual time per task. Don't tell them you're evaluating their speed – frame it as understanding workflow patterns to improve scheduling.
| Task Component | Tech A (experienced) | Tech B (mid-level) | Tech C (newer) |
|---|---|---|---|
| Inspection | 6-8 min | 7-10 min | 10-14 min |
| Derailleur adj | 8-10 min | 11-14 min | 15-20 min |
| Brake adj | 7-9 min | 9-12 min | 12-16 min |
| Wheel true | 5-7 min | 7-10 min | 10-15 min |
| Lubrication | 4-5 min | 5-6 min | 6-8 min |
| Test ride | 5-6 min | 6-8 min | 7-10 min |
| Total range | 35-45 min | 45-60 min | 60-83 min |
Below is a workflow to track component times per tech.
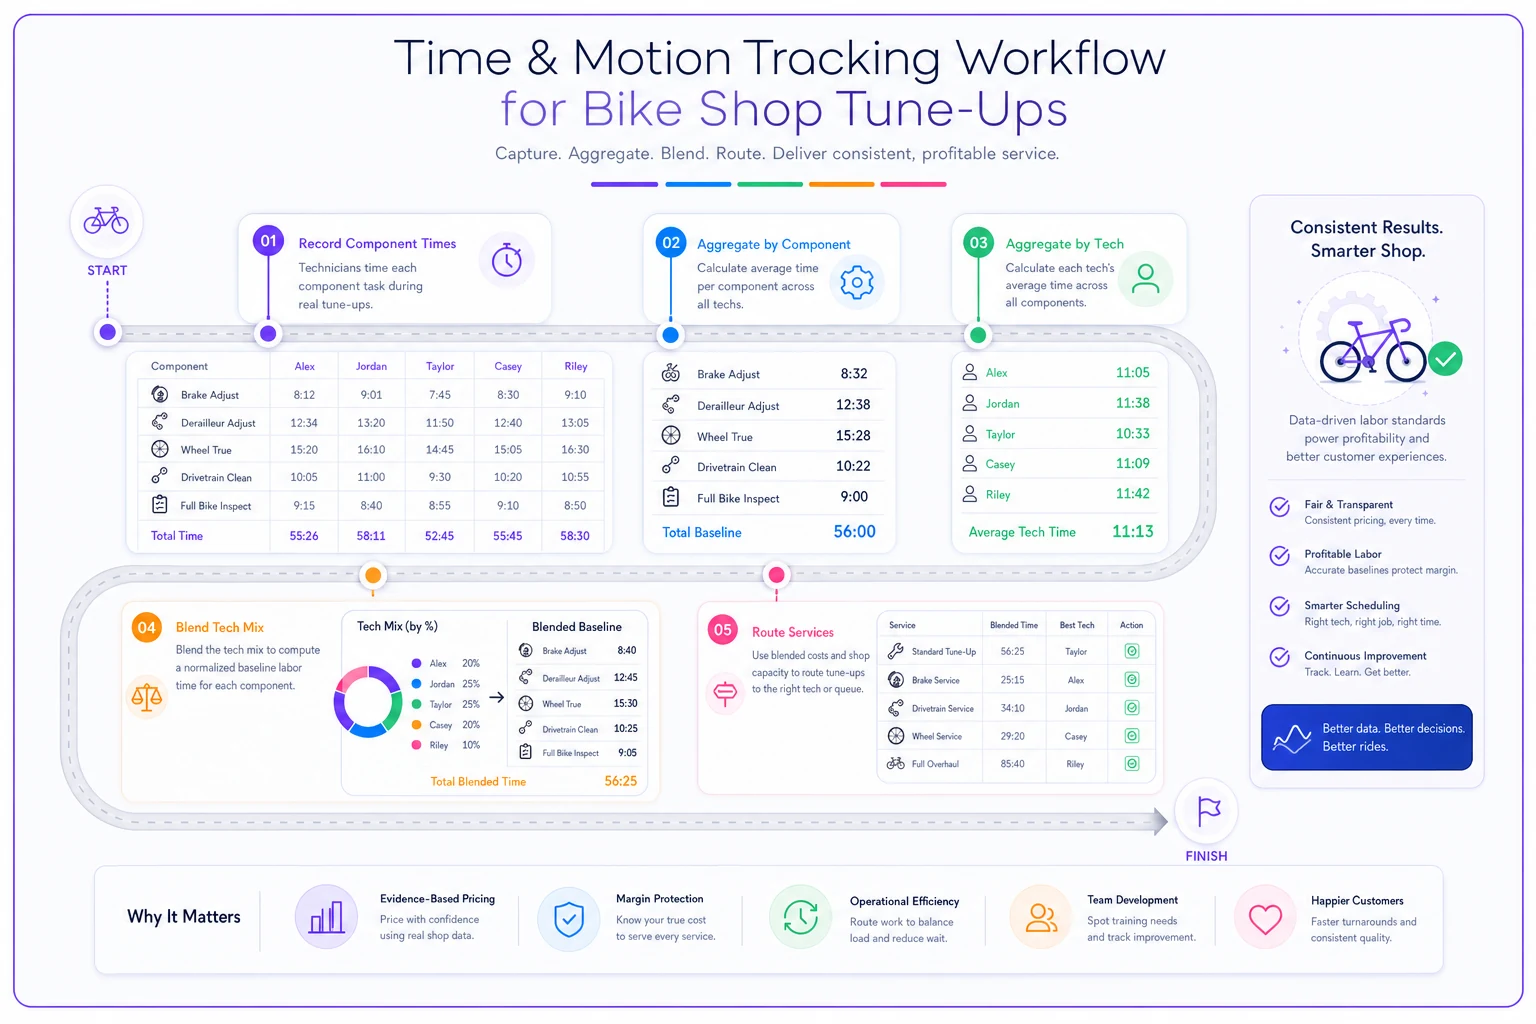
Tech A completes tune-ups 40% faster than Tech C. If you price assuming Tech B's time, you lose money on Tech C's work and leave profit on the table with Tech A.
The solution isn't pricing each tech differently. It's understanding your actual blended cost based on who typically handles which services. If Tech C does 60% of tune-ups because Tech A focuses on complex repairs, your baseline should reflect that mix.
Parts markup bands that protect margins
Parts markup needs bands, not a flat percentage. Small consumables carry the highest percentage markup but contribute least to total revenue. Expensive components carry lower percentage markup but drive absolute margin dollars.
Four bands work based on cost ranges:
-
Band 1
Under $5 per part
- Cables, housing, tape, small hardware - Mark up 150-200% - Customer pays $2.50-3.00 for a $1 part -
Band 2
$5-25 per part
- Grips, pedals, chains, brake pads - Mark up 75-100% - Customer pays $17.50-20 for a $10 part -
Band 3
$25-75 per part
- Cassettes, chainrings, basic wheels - Mark up 50-65% - Customer pays $75-82 for a $50 part -
Band 4
Over $75 per part
- Groupsets, wheels, frames - Mark up 35-45% - Customer pays $135-145 for a $100 part
This structure maintains healthy margins on labor-intensive services using small parts while staying competitive on big-ticket items where customers price shop.
Apply bands to a typical overhaul:
-
New cables/housing (Band 1)
Cost $8, marked up to $20
-
New chain (Band 2)
Cost $15, marked up to $27
-
New cassette (Band 3)
Cost $45, marked up to $70
-
Total parts cost
$68
-
Total parts revenue
$117
-
Blended markup
72%
Compare this to flat 50% markup:
-
Total parts revenue would be $102
-
You lose $15 in margin per overhaul
Track parts mix per service to keep your blended markup accurate as component choices change.
On 200 overhauls per year, proper banding adds $3,000 in parts margin without raising headline prices.
Overhead allocation per tech (not per hour)
Standard overhead calculation divides total monthly overhead by total available tech hours. A shop with $8,000 monthly overhead and three full-time techs (480 total hours) gets $16.67 per hour overhead rate. Every tech, every service, same burden.
This misses huge utilization differences between techs and service types.
Track actual billable hours per tech for one month. Include only time directly charged to customers, not warranty work, shop maintenance, or idle time. Patterns emerge:
-
Tech A (senior) 136 billable hours of 160 available (85% utilization) - Focuses on quick services and repairs - Minimal diagnosis time - Overhead per billable hour: $8,000 ÷ 136 = $58.82
-
Tech B (mid) 112 billable hours of 160 available (70% utilization) - Mix of services and complex repairs - Moderate diagnosis time - Overhead per billable hour: $8,000 ÷ 112 = $71.43
-
Tech C (junior) 88 billable hours of 160 available (55% utilization) - Learning curve on many jobs - Significant non-billable training time - Overhead per billable hour: $8,000 ÷ 88 = $90.91
Using the same overhead rate for all three techs means you're underpricing Tech C's work by $74 per hour while overpricing Tech A's work by $42 per hour.
The fix: assign services to techs based on both skill match and true overhead burden. Route simple tune-ups to Tech A where possible. Reserve Tech C for lower-margin work where training value offsets profitability concerns.
Worksheets for common services
Building your own pricing worksheets requires capturing five elements: labor time by tech level, parts costs by band, overhead allocation, target margin, and competitive ceiling.
Basic Tune-Up Worksheet
Labor calculation:
-
Baseline time
45 minutes (Tech B standard)
-
Tech wage
$22/hour = $16.50 labor cost
-
Overhead allocation
45 min × $71.43/hour = $53.57
-
Total labor burden
$70.07
Parts calculation:
-
Cable adjustment only, no parts
-
Shop supplies (chain lube, degreaser)
$2
Total cost: $72.07 Target margin: 35% Minimum price: $110.87 Market rate: $65-85 Pricing problem identified - costs exceed market rate
Resolution: Reduce scope (30-minute express tune-up) or bundle with higher-margin services.
Major Overhaul Worksheet
Labor calculation:
-
Baseline time
2.5 hours (Tech A/B blend)
-
Blended wage
$24/hour = $60 labor cost
-
Blended overhead
2.5 × $65/hour = $162.50
-
Total labor burden
$222.50
Parts calculation (typical):
-
Cables/housing
$8 → $20
-
Chain
$15 → $27
-
Cassette
$45 → $70
-
Brake pads
$12 → $20
-
Bar tape
$8 → $16
-
Parts cost
$88
-
Parts revenue
$153
-
Parts margin
$65
Total cost: $310.50 Total revenue at 40% margin: $517.50 Market rate: $195-295 Major pricing problem - true cost far exceeds market ceiling
This reveals why many shops lose money on overhauls. The solution involves service redesign, not just price adjustment.
Creating modular service menus
When worksheets show services can't hit margins at market prices, redesigning service structure beats raising prices customers won't pay.
Split the major overhaul into modules:
-
Drivetrain Refresh - $145 - Chain, cassette, cables - 75 minutes labor - Higher parts margin offsets lower labor
-
Brake Overhaul - $95 - Pads, cables, bleed if hydraulic - 45 minutes labor - Clear scope reduces time variance
-
Contact Point Refresh - $65 - Tape/grips, saddle adjustment - 30 minutes labor - High-margin add-on service
Customers can choose combinations based on actual need. Total revenue for all three ($305) exceeds the traditional overhaul price while each module maintains healthy margins. Many customers only need one or two modules, improving conversion rates.
Seasonal pricing adjustments
Bike shop demand swings create natural pricing opportunities. Most shops keep prices static year-round, missing chances to both maximize peak season margins and fill slow season capacity.
March through September represents 75% of annual service volume for most shops. During these months, customers value speed over price. A three-day turnaround commands premium pricing. Same service in November with next-day completion struggles to get standard rate.
Build seasonal modifiers into your worksheets:
-
Peak season (Apr-Aug) - Express surcharge: +$15-25 for 48-hour turnaround - Saturday pickup: +$10 - While-you-wait: +50% on labor rate
-
Shoulder season (Mar, Sep-Oct) - Standard pricing - Multi-bike discounts: -10% for 2+ bikes
-
Slow season (Nov-Feb) - Service specials: -15-20% on labor - Package deals: Tune-up + storage for fixed price - Group rate clinics
A shop doing 1,200 services annually might see this distribution:
-
900 services in peak season with average +$12 modifier = $10,800 additional revenue
-
200 services in shoulder season at standard rates
-
100 services in slow season at -15% to fill capacity
Peak season surplus more than offsets slow season discounts while maintaining tech utilization year-round.
Software tracking versus manual worksheets
Manual pricing worksheets work until you hit about 20 services per week. Beyond that, tracking actual costs versus estimates becomes a full-time job nobody actually does.
The breakdown happens in three places. Techs don't consistently log actual time per service. Even with simple tracking sheets, compliance drops below 50% after two weeks. Parts costs change constantly but worksheets get updated quarterly at best. Nobody reconciles estimated versus actual margins until month-end P&L reviews show problems.
Modern bike shop management platforms solve these gaps by embedding cost tracking into normal workflow. When a tech starts a service, the system timestamps automatically. Parts get pulled from inventory with current costs, not last quarter's estimates. Margin reports generate daily, not monthly.
Pattern recognition across hundreds of services becomes valuable. A platform tracking 10 shops discovers that brake bleeds take 23% longer in humid climates. Wheel builds by techs with less than one year experience run 45% over standard time. These insights let you price based on your actual operation, not industry averages.
Manual shops might review pricing twice per year. Shops with operational software adjust monthly based on actual performance data. When parts costs spike or tech efficiency improves, pricing adapts immediately instead of waiting for the next review cycle.
The compounding effect of proper pricing
Getting bike shop service pricing right creates cascading improvements throughout the operation. Techs see their efficiency reflected in shop profitability. Service advisors confidently quote prices knowing margins are protected. Owners reinvest profits into training and equipment instead of subsidizing underpriced work.
A shop implementing these pricing methods typically sees 8-12% margin improvement within 90 days. On $300,000 annual service revenue, that's $24,000-36,000 straight to the bottom line.
Techs start suggesting modular services instead of defaulting to full overhauls. Service advisors identify which customers will pay express charges versus those who'll wait for standard turnaround. The entire team begins thinking about profitability per bay hour, not just completion rates.
Proper pricing reveals which services actually make money. Many shops discover their "signature service" loses money while a basic offering they barely promote drives profits. Armed with real cost data, they restructure service menus around profitable offerings instead of tradition.
The bike shop service pricing challenge isn't about charging more. It's about understanding true costs, allocating overhead accurately, and designing services that can hit margins at prices customers will pay. Without worksheets that capture these elements, you're guessing at profitability. With them, you're engineering it into every service ticket.
Ready to revolutionize your bike shop operations?
Join hundreds of bike shops using Bicyclly to save time, increase revenue, and deliver exceptional customer service.