

Most bike shops handle slow-moving parts backwards. They either stockpile everything (dead capital) or wait until they're out (lost repairs). The middle ground exists, but you need to understand how reorder points work when brake cable ends move three units monthly while chains fly off shelves.
The operational killer? Shops apply big-box reorder formulas to micro-SKUs. A derailleur hanger that sells twice monthly doesn't follow the same rules as tubes selling 40+ weekly. Yet shops treat them identically, then wonder why they're constantly expediting orders or sitting on dusty inventory.
After building inventory systems for bike shops ranging from solo mechanics to 8-bay operations, the pattern shows clearly. Small parts inventory fails because shops try managing 400+ SKUs with rules designed for 50 high-movers. The solution isn't complex—match your reorder system to your actual repair volume and shop size.
Why standard reorder formulas break on bike shop micro-SKUs
Traditional reorder point math assumes predictable demand. Take average daily usage, multiply by lead time, add safety stock. Works great for Walmart managing toothpaste. Falls apart when tracking spoke nipples that might not move for three weeks, then suddenly need 20 for a wheel build.
The formula breaks because bike parts demand clusters around repair types, not calendar days. A shop might go weeks without touching internal cable routing parts, then get three bikes needing the exact same obscure grommet. Standard formulas see zero movement and suggest zero stock. Then you're sending someone to another shop to borrow parts mid-repair.
In a 3-tech shop: Monday needs zero derailleur hangers. Tuesday needs zero. Wednesday morning, first ticket needs a SRAM UDH. Afternoon ticket needs the same. Thursday, another one. Your "average daily usage" calculation says 0.6 units per day. Reality says you needed three in 48 hours and couldn't complete repairs without them.
The disconnect happens because averaging smooths out the exact pattern you need to capture—clustered demand around specific repair types. When Mrs. Chen brings in her 2019 Trek Domane with shifting issues, you either have that specific hanger or you don't. There's no "partial stock" that helps.
Mining repair tickets for actual usage patterns
Your repair tickets contain everything needed for intelligent reorder points. Not the invoices—the actual repair tickets showing what got installed. Most shops track this data but never use it for inventory decisions.
Never miss a sale or service appointment again.
Bicyclly helps you manage every sale, repair, and booking with ease and accuracy.
- Unified inventory and sales tracking
- Automated customer notifications
- Service appointment scheduling
No credit card required
Start with 90 days of closed tickets. Don't need fancy reports, just the parts used per ticket. Export to a spreadsheet if your system allows it, or spend an afternoon pulling numbers manually. You want actual installation counts, not sales. That derailleur hanger might have been "sold" six times but only installed four times (two were customer purchases for home repairs).
-
Daily movers - tubes, cables, chain links
-
Weekly movers - brake pads, housing, ferrules
-
Monthly movers - cassettes, specific hangers, headset bearings
-
Sporadic movers - proprietary parts, vintage components
For each category, count actual usage events, not quantities. If you used spoke nipples three times in 90 days, that's three usage events—doesn't matter if you used 4 nipples or 40. This tells you how often you reach for that SKU, which matters more than volume for reorder triggers.
Count usage events, not quantities, to determine how often you reach for that SKU.
A two-tech shop working 22 days monthly sees patterns quickly. That Shimano 11-speed quick link shows up in repairs every third day. The Park Tool tire lever (yes, you stock replacements for customers who break them) appears once every two weeks. The weird Specialized proprietary headset bearing? Three times per quarter, but always urgent when needed.
Lead time reality for different supplier types
Supplier lead times aren't what catalogs claim. QBP says 2-3 days. Your experience says 2-7 days depending on warehouse stock. Local distributors promise next-day but run out of common items during peak season. Understanding actual lead times, not promised ones, prevents stockouts.
| Supplier Type | Catalog Promise | Actual Lead Time | Peak Season Impact |
|---|---|---|---|
| Primary distributors (QBP, BTI, KHS) | 2-3 days | 3-4 business days | Add 2 days |
| Secondary distributors (regional) | Next day | 1-2 days for stock items | Limited selection |
| Direct manufacturers | 3-5 days | 3 days to 3 weeks | Highly variable |
| Local shop transfers | Same day | Same day if relationships exist | Unreliable as primary |
Track your last 20 orders from each supplier. Note order date, promised date, actual receipt date. The gap between promised and actual becomes your real lead time for planning. That QBP order placed Monday afternoon that arrives Friday morning? That's 4 days, not the "2-day shipping" advertised.
For solo shops, add one day buffer to everything. You can't always process receiving immediately. That Thursday delivery might not get checked in until Friday afternoon when repairs slow down.
The shop-size lookup table that works
Shop size completely changes reorder dynamics. A solo mechanic can visually scan inventory daily. An 8-bay shop needs systematic triggers or parts vanish without anyone noticing.
Solo mechanic (1 tech, <15 repairs weekly):
-
Daily movers
Reorder at 3 days supply
-
Weekly movers
Reorder at 10 days supply
-
Monthly movers
Reorder at 1.5 months supply
-
Sporadic
Order as needed, no standing stock
Small shop (2-3 techs, 15-40 repairs weekly):
-
Daily movers
Reorder at 5 days supply
-
Weekly movers
Reorder at 14 days supply
-
Monthly movers
Reorder at 2 months supply
-
Sporadic
Keep 1 unit minimum if under $20 cost
Multi-bay (4+ techs, 40+ repairs weekly):
-
Daily movers
Reorder at 7 days supply
-
Weekly movers
Reorder at 18 days supply
-
Monthly movers
Reorder at 2.5 months supply
-
Sporadic
Keep 2 units minimum if under $30 cost
The multipliers increase with shop size because coordination complexity grows fast. In a solo shop, you know you used the last derailleur hanger. In a 5-tech shop, nobody knows who grabbed the last one from the bin until someone needs it.
Example: 11-speed chains in a 3-tech shop averaging 1.5 installations daily. With 4-day real lead time from primary supplier:
Base need: 1.5 x 4 = 6 units Shop size buffer (14-day for weekly mover): 1.5 x 14 = 21 units Reorder point: When inventory hits 21 chains
Compare this to the same shop using generic formulas suggesting 10 units safety stock. They'd run out constantly during busy periods.
Safety stock calibrated for repair urgency
Not all stockouts hurt equally. Missing the right tube delays a repair 10 minutes while someone grabs one from retail floor. Missing a specific derailleur hanger kills the repair entirely, possibly for days.
Classify parts by repair impact:
Critical stoppers: Part absence kills repair completely
-
Specific hangers
-
Proprietary hardware
-
Uncommon bearings
Safety stock: 2x normal buffer
Major delays: Part absence requires workaround or substitute
-
Specific brake pads (can sometimes substitute)
-
Cable housing ferrules (can make work without)
-
Chainring bolts (might find alternatives)
Safety stock: 1.5x normal buffer
Minor inconvenience: Easy substitutes available
-
Generic cables
-
Common bearings
-
Standard bolts
Safety stock: 1x normal buffer
A real scenario: Shop tracks Park Tool CT-3.3 chain pins as "minor inconvenience" since techs can use alternatives. But Campagnolo 11-speed chain pins? Those are critical stoppers—no substitute exists. Same product category, completely different stocking rules.
This classification changes seasonally. Trainer-specific thru-axle adapters might be "minor" in June but become "critical" in November when indoor season starts. Your safety stock adjusts accordingly.
Avoiding the "order everything" trap with category rules
Small shops often try maintaining stock on 500+ SKUs when they should focus on 150 that matter. The rest creates complexity without value. Category rules prevent inventory sprawl while ensuring critical parts stay available.
-
Solo shops Stock maximum 100-120 SKUs in service inventory
-
2-3 tech shops Stock maximum 150-200 SKUs
-
4+ tech shops Stock maximum 250-300 SKUs
Within these limits, allocate by category importance:
Must-stock categories (60% of SKU count):
-
Cables/housing
-
Basic chains
-
Common brake pads
-
Tubes in popular sizes
-
Basic bearings
-
Common hangers
Selective-stock categories (30% of SKU count):
-
Specific cassettes/chainrings
-
Premium chains
-
Specific brake parts
-
Less-common bearings
-
Seasonal items
Order-as-needed categories (10% flex):
-
Vintage parts
-
Extreme sizes
-
Proprietary electronics
-
Cosmetic parts
What this looks like operationally: A 2-tech shop stocks every Shimano/SRAM 9-12 speed chain (8 SKUs), but only the two most common Campagnolo chains. They stock 15 different brake pad compounds for common systems, but order Magura pads as needed. They keep 20 derailleur hangers for bikes they see monthly, but order everything else per repair.
The discipline comes from monthly SKU audits. Count unique SKUs in service inventory. Over limit? Cut the bottom movers. Under limit? Add items from your "ordered 3+ times" list.
The minimum order problem and bundling strategies
Distributor minimums create their own inventory challenges. $150 minimum from QBP means you can't just order three derailleur hangers when you hit reorder point. Smart shops bundle orders around predictable reorder cycles.
Track your reorder triggers across categories and find natural bundling windows. If chains typically trigger every 8-10 days and cables every 5-6 days, you'll hit minimum naturally every 5-10 days without forcing orders.
Create a reorder schedule board:
Monday check:
-
All daily movers
-
Any critical stockouts
Wednesday check:
-
Weekly movers hitting triggers
-
Build toward minimum if close
Friday check:
-
Monthly movers
-
Tomorrow's repairs needs
-
Weekend emergency stock
This systematic approach means you're never scrambling to fill minimums with random items. When chains hit reorder on Tuesday and you're at $89 toward minimum, you know Wednesday's cable check will push you over.
For smaller shops, partner with neighboring shops for group orders. Three solo mechanics each needing $50 of parts can combine for single order, splitting shipping. Requires coordination but saves substantial cost over time.
When the method breaks down
This system handles 90% of parts elegantly but breaks in predictable ways. Knowing failure points prevents surprise stockouts.
New model years wreck historical data. When Trek changes hanger specs across their line, your 90-day history becomes worthless for those SKUs. Solution: Flag new model parts separately, order conservatively first quarter, then apply normal rules once patterns emerge.
Seasonal swings distort averages. Fat bike tire sealant might show zero summer usage then spike 10x in December. Solution: Maintain seasonal adjustment notes. "5x multiplier Nov-Feb" beats recalculating every season.
Warranty clusters create fake demand. Three customers with same defective part doesn't mean you need stock. It means manufacturer has problem. Track warranty separately from normal repairs.
Tourist seasons in destination towns completely break standard patterns. That Colorado shop seeing 3x volume during peak summer can't use April ticket data for July planning. Build separate tourist season model or accept higher stock levels June-August.
Mechanic preferences skew data. One tech loves KMC chains, another swears by Shimano. When vacation schedules hit, your "average" usage becomes meaningless. Track per-tech when possible, or accept higher safety stock during vacation seasons.
Building it without complex systems
You don't need expensive inventory software to run this method. A spreadsheet and discipline beat fancy systems with poor processes. The key is consistent data capture and regular review cycles.
Basic spreadsheet setup:
| Column | Content |
|---|---|
| A | SKU |
| B | Description |
| C | 90-day usage count |
| D | Average daily usage (C/90) |
| E | Lead time days |
| F | Shop size multiplier |
| G | Reorder point (D x E x F) |
| H | Current stock |
| I | Order trigger (IF H < G, "ORDER", "OK") |
Update weekly, takes 20 minutes once established. Pull current counts from inventory, refresh any items showing "ORDER" flag. Place orders based on bundling strategy above.
The sophistication comes from the lookup tables and rules, not the tracking mechanism. A solo mechanic using index cards with reorder points written on shelf tags beats a multi-bay shop with software but no process.
For shops ready to scale, operational software platforms handle this automatically. Modern systems pull repair ticket data directly, calculate rolling averages, and adjust for shop size automatically. They'll generate purchase orders when triggers hit, maintaining minimum order requirements across suppliers. The underlying logic remains the same—it's just executed consistently without manual effort.
The evolution path: Start with spreadsheets to prove the method. Once comfortable, upgrade to basic inventory software. When managing 200+ SKUs becomes overwhelming, consider AI-powered platforms that track patterns across thousands of data points and predict needs before stockouts occur.
The 4-week implementation plan
A visual plan for the four-week rollout.
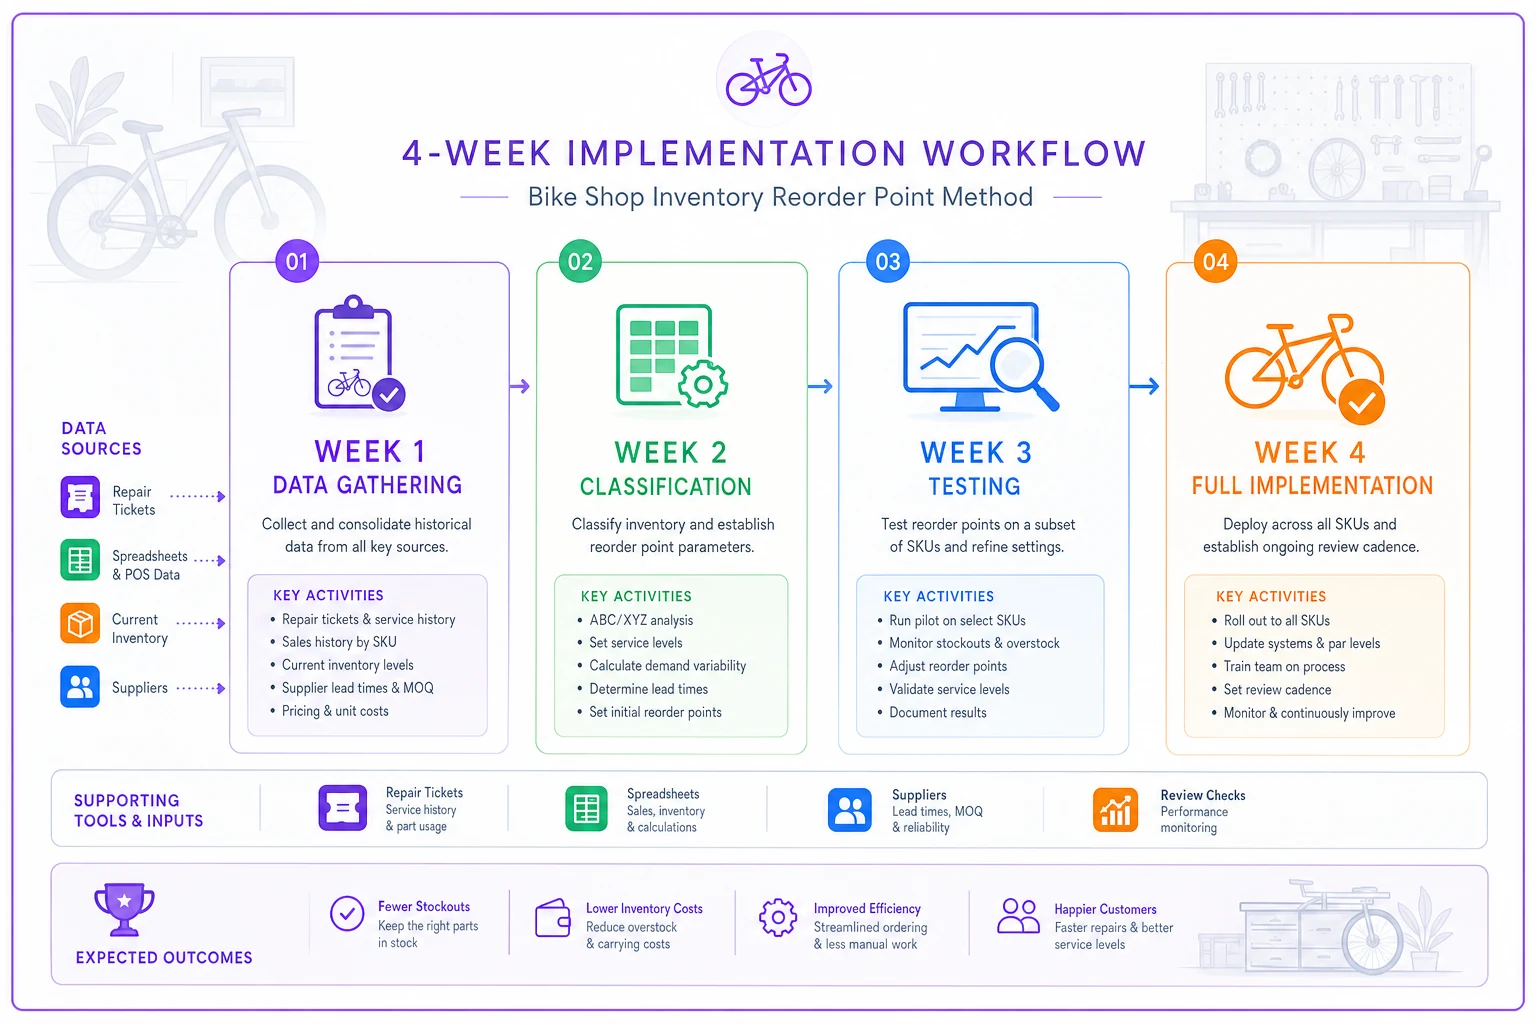
Week 1: Data gathering
-
Export 90 days of repair tickets
-
Count actual parts usage (not sales)
-
List all suppliers with real lead times
-
Note your shop's actual repair volume
Week 2: Classification
-
Group parts by movement frequency
-
Assign safety stock multipliers by criticality
-
Apply shop-size adjustments
-
Calculate initial reorder points for top 50 SKUs
Week 3: Testing
-
Run parallel with existing system
-
Track trigger accuracy
-
Note any stockouts or excess orders
-
Adjust multipliers based on results
Week 4: Full Implementation
-
Expand to 150-200 SKUs based on shop size
-
Set up bundling schedule
-
Create review rhythm
-
Document process for consistency
Most shops see immediate improvement in week 3. That constant scramble for parts reduces dramatically. Emergency orders drop 70%. Dead stock accumulation slows since you're ordering based on actual usage, not guesses.
The real win comes after 2-3 months when patterns stabilize. You'll find yourself explaining to other shops how you always have that obscure part in stock while maintaining lower inventory investment. The answer isn't magic—it's matching your reorder system to your actual operation instead of forcing generic formulas onto micro-SKU reality.
Ready to revolutionize your bike shop operations?
Join hundreds of bike shops using Bicyclly to save time, increase revenue, and deliver exceptional customer service.