
A bike shop owner in Boulder stared at $47,000 worth of dead inventory last October. Premium road bike components that nobody wanted once the leaves started falling. His mechanics kept running to the local distributor three times a week for basic brake pads and shift cables because they'd blown through their winter service stock by mid-September.
Twelve years running that shop, and seasonal forecasting still felt like throwing darts blindfolded.
Most bike shops handle inventory forecasting the same way: look at last year's numbers, add some gut feeling about the weather, maybe check what the big brands are pushing, and hope for the best. Then scramble when reality hits differently. The scramble usually means emergency orders with overnight shipping fees, or worse, turning away repair work because you're out of basic parts during peak season.
Your repair tickets already tell you what's coming. Not in some vague "we do more tune-ups in spring" way, but with actual patterns you can track and use. Every ticket has a story about what breaks, when it breaks, and what customers are willing to fix versus replace. Stack enough of those stories together and you've got a forecasting system that actually works.
Why Traditional Bike Shop Forecasting Falls Apart
Bike shops face a weird inventory challenge that most retail doesn't deal with. You're managing three completely different beasts at once: retail floor inventory that needs to look good and move fast, service parts that customers never see but mechanics burn through daily, and seasonal items that are either flying off the shelves or collecting dust depending on the month.
The traditional approach usually involves some combination of distributor recommendations, last year's sales reports, and whatever the owner remembers about that one crazy spring when everyone wanted gravel bikes. This works okay when patterns stay consistent. But patterns rarely stay consistent in bike shops.
A new trail system opens nearby and suddenly your mountain bike parts demand doubles. The city adds protected bike lanes and commuter accessories explode. An unseasonably warm February brings riders out early, but your spring inventory isn't arriving until March because you ordered based on last year's timeline.
Meanwhile, your repair tickets are screaming the real story. That uptick in derailleur hanger replacements started three weeks ago when the new trail riders began coming in. The surge in flat repairs happened right after the city construction project left debris all over the main commuter corridor. Brake pad replacement patterns shifted earlier this year because warm weather meant people actually rode through winter instead of storing their bikes.
Most shops never connect these dots systematically. The service manager knows what parts they're burning through, but that information rarely makes it to whoever's placing inventory orders. The owner sees sales trends but doesn't factor in the repair patterns that predict what's coming next. Each department operates in its own bubble, making decisions based on partial information.
The Hidden Intelligence in Your Repair Tickets
Repair tickets are basically time machines for inventory planning. A customer rolling in today with worn brake pads tells you they'll probably need new ones again in 6-8 months if they keep riding at the same pace. Multiply that by your regular customer base and you've got next season's brake pad forecast.
Never miss a sale or service appointment again.
Bicyclly helps you manage every sale, repair, and booking with ease and accuracy.
- Unified inventory and sales tracking
- Automated customer notifications
- Service appointment scheduling
No credit card required
But it goes deeper than just replacement cycles. Repair patterns reveal riding behaviors, which predict future needs. When you start seeing more broken spokes and bent rims in tickets, you know riders are pushing harder or riding rougher terrain. That means increased demand for stronger wheels, better tires, and probably more suspension service parts in the coming months.
One shop owner discovered this accidentally when their ticketing system crashed and they had to manually review three months of paper tickets to reconstruct their records. Going through them all at once, the patterns jumped out. Every time they saw a cluster of similar repairs, they could trace it back to a specific trigger - weather events, local cycling events, even things like school starting or ending.
The ticket data also reveals customer segments you might not realize you have. Weekend warriors who bring bikes in twice a year for major services. Daily commuters who need constant small fixes. Serious riders who maintain their own bikes but come in for specific technical work. Each segment has different seasonal patterns and inventory needs.
A shop in Portland started categorizing repairs by customer type and found their forecasting accuracy jumped from around 60% to the mid-80s. They weren't using fancy software or complex models. Just basic tracking of who needs what and when, pulled straight from their existing repair tickets.
Building Your Ticket-Based Forecasting Framework
The framework doesn't require complex math or expensive software. Start with your repair tickets from the past year. Two or three years of data is better, but one year is enough to begin.
Pull every ticket and mark down:
-
Date of service
-
Type of repair
-
Parts used
-
Customer type (commuter, recreational, performance)
-
Bike type
Look for patterns in 30-day windows. Don't try to analyze everything at once. Pick one category - let's say brake pads - and track how demand changes month by month. You'll quickly see the seasonal waves, but more importantly, you'll spot the leading indicators.
For most shops, brake pad replacements spike about 3-4 weeks after the first good weather of spring. Why? Because that's when people pull bikes out of storage, ride for a few weeks, and realize their brakes feel mushy. The pattern is so consistent you can practically set your calendar by it.
Next, layer in simple external signals. Weather is obvious, but think broader. Local event calendars tell you when charity rides and races will drive demand. School schedules predict when parent bikes get dusty (during school) versus when family riding picks up (summer break). Construction notices warn you about debris that causes flats.
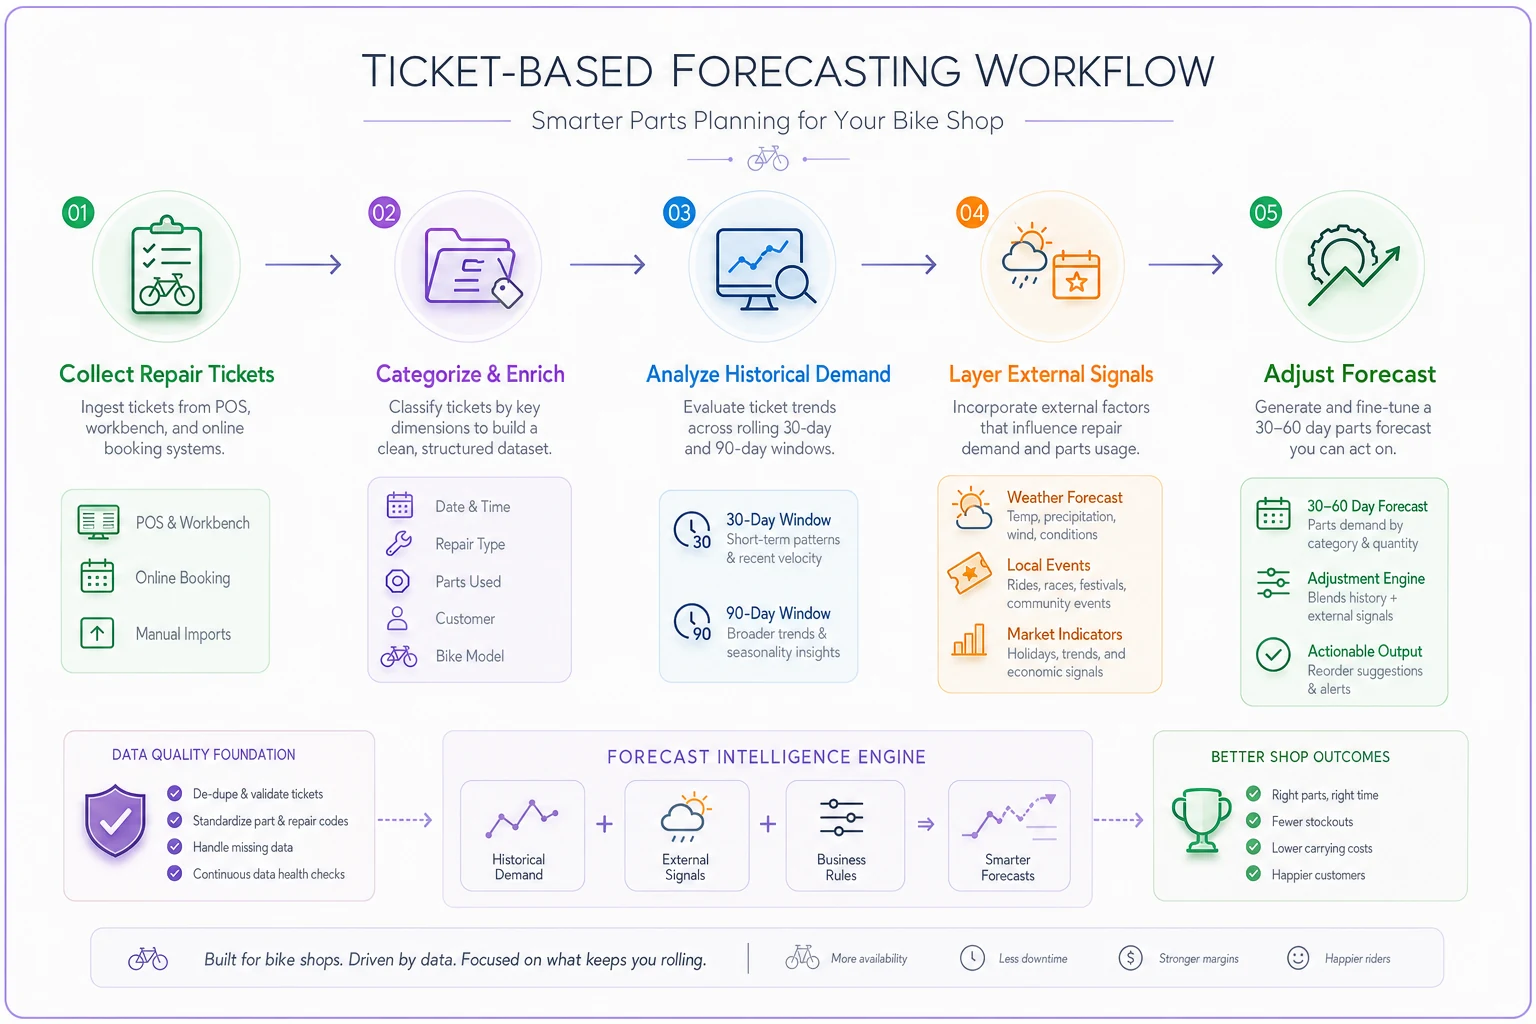
The framework in practice: Review trailing 90 days of tickets → identify top 10 parts/services by volume → check same period last year for seasonal patterns → look ahead 30-60 days for known events/weather patterns → adjust baseline forecast up or down based on current trend.
Here's a quick visual of the workflow.
You're not trying to predict everything. Focus on your top 20% of parts and services that generate 80% of your headaches when you run out. The fancy carbon components can still be ordered as needed. It's the tubes, cables, brake pads, chains, and common wear items that kill you when you're caught short.
Temperature, Events, and Rolling Windows
Weather affects bike shops differently than most people assume. It's not just "nice weather equals more riders." The relationship is way more nuanced and varies by region and rider type.
In Phoenix, ridership actually drops during the perfect-weather months of January and February because all the snowbirds are in town clogging the roads, making cycling feel less safe. But come brutal-hot July, the early morning riding scene explodes because dedicated cyclists adapt their schedules.
Track temperature bands, not just "good" or "bad" weather. Most shops find their sweet spots: maybe 55-75°F for commuters, 45-65°F for serious roadies who don't mind bundling up, and 60-80°F for casual weekend riders. When you know your bands, you can predict not just volume but type of service needed.
A shop in Minnesota tracks "first 50-degree day" as their most important forecasting trigger. That single day drives more service demand than any other factor because it's when everyone simultaneously decides winter is over and bikes need to come out. They literally schedule extra staff and pre-order common parts based on the extended weather forecast.
Events create predictable spikes but with different inventory impacts. Charity rides bring in tons of casual riders who need basic tune-ups and might buy accessories. Racing events attract serious cyclists who need specific high-end parts and are willing to pay for overnight shipping if needed. Family events and festivals generate kids bike repairs and basic adult bike maintenance.
Rolling windows keep your forecast fresh without constant recalculation. Instead of doing massive quarterly planning sessions, update your 60-day forecast every two weeks. Pull the last two weeks of tickets, compare to forecast, adjust the next 60 days accordingly. This catches trends while they're still developing, not after you've already run out of inventory.
Think of it as a constant conversation between what you predicted and what actually happened. The gap between those tells you how to adjust. If brake pad usage is running 20% above forecast for two straight update periods, that's not random variation - something changed in riding patterns and your forecast needs to catch up.
Your 30-Minute Weekly Forecasting Session
Every Monday morning (or your slow day), grab coffee and your repair tickets from the past week.
First 10 minutes: Count and categorize. How many repairs total? What were the top 5 part categories used? Any unusual patterns or multiple similar repairs? Write these numbers on a simple tracking sheet or spreadsheet - date, total tickets, top parts, notes.
Write these numbers on a simple tracking sheet or spreadsheet - date, total tickets, top parts, notes.
Next 10 minutes: Compare to your forecast. Pull up what you predicted for this week (even if it's just gut feeling you wrote down). Where were you right? Where were you wrong? More importantly, why? Was it weather, an event you forgot about, or a genuine shift in customer behavior?
Next 5 minutes: Check external factors for the next 4 weeks. Weather forecast, local event calendar, anything that might drive or suppress riding. Make notes directly on your calendar.
Final 5 minutes: Adjust your next 4-week parts order. Based on the variance you just saw and the factors coming up, do you need to bump up any orders? Push anything out? This isn't a complete reforecast, just tweaks to what you already planned.
That's it. Thirty minutes of actual thinking about your data instead of pure guessing.
The compound effect kicks in after about 6-8 weeks. Your predictions get tighter because you're constantly calibrating against reality. You start noticing patterns you never saw before. That weird spike in tire sales always happens two weeks after the first rain because people realize their tires are bald when roads get slick.
One owner told me this process saved him about $8,000 in his first season just from avoiding emergency overnight orders. Not because his forecasting became perfect, but because he caught trends early enough to place regular orders instead of panicking.
Common Forecasting Mistakes That Wreck Bike Shops
The biggest mistake is forecasting retail and service inventory the same way. Retail customers browse and buy based on desire and impulse. Service customers need specific parts right now to fix their bike. Completely different beasts requiring different strategies.
"Last year laziness" kills shops - just ordering whatever you ordered last year with minor tweaks. Problem is, last year might have been weird. Maybe there was a bike shortage so people fixed old bikes instead of buying new ones. Maybe a competitor closed and you got all their service business. Using last year as your only baseline bakes in all those anomalies.
Shops also tend to forecast popular items well but completely blow it on the mundane stuff. They'll nail the quantity of hot new gravel bikes to order but run out of basic shift cables in week two of spring. The boring stuff is what keeps service bays profitable and customers happy.
Over-relying on distributor recommendations is another trap. Distributors push what they need to move, not necessarily what your specific market needs. Their "hot seller" might be perfect for shops in Portland but completely wrong for your customer base in Tucson. They don't know your local trail conditions, your customer demographics, or your competition.
The emotional forecasting mistake hurts too. Shop owners fall in love with certain products or categories. They over-order high-end components because that's what they personally ride and appreciate, while under-ordering the basic stuff that actually pays the bills. Your personal preferences shouldn't drive your professional inventory decisions.
Ignoring service ticket patterns while obsessing over retail sales reports might be the most common mistake. Retail sales are lagging indicators - they tell you what already happened. Service tickets are leading indicators - they predict what's about to happen. An uptick in certain repairs today predicts parts and accessory sales tomorrow.
Creating Your Simple Template System
You don't need complicated software to start. A basic spreadsheet with four sheets will do the job:
| Sheet | Description |
|---|---|
| Sheet 1: Weekly Ticket Tracker | Columns for date, ticket count, top 5 parts used, weather that week, and notes. One row per week. After 12 weeks you'll start seeing patterns clear as day. |
| Sheet 2: Monthly Forecast | Your predicted needs for the next 60 days, broken down by major category. Update this every two weeks based on your ticket tracker trends. |
| Sheet 3: Event Calendar | Every ride, race, festival, construction project, or weather event that might impact demand. Include last year's impact if you remember it. |
| Sheet 4: Variance Report | What you predicted versus what actually happened. This is your learning document. Over time, you'll see which factors you consistently over or under-weight. |
Keep it simple enough that you'll actually use it. A perfect system you abandon after two weeks is worthless. A basic system you stick with will transform your operation.
Start with just your top 10 SKUs if tracking everything feels overwhelming. Tubes, common brake pads, shift cables, chains for popular bikes, bar tape, whatever you run out of most often. Get good at forecasting those before expanding.
Some shops print these sheets and keep them on a clipboard. Others use Google Sheets so multiple people can update. The tool doesn't matter nearly as much as the consistency of actually doing it.
When This System Actually Makes Sense (And When It Doesn't)
This framework works best for shops doing at least 15-20 repairs per week consistently. Below that volume, the patterns get too noisy to be reliable. You're better off with simple min/max reordering based on pure usage.
It's also perfect for shops where service makes up 30% or more of revenue. If you're primarily retail with occasional repairs, the ticket patterns won't give you enough signal to matter. Focus on retail sales patterns instead.
Multi-location shops need to be careful. Each location probably has different patterns based on local demographics and riding conditions. Don't try to forecast them all together. Run separate frameworks or you'll smooth out all the useful signal into meaningless averages.
New shops (less than 18 months old) should wait before implementing this. You need at least one full season cycle of data to make this work. Until then, lean on conservative ordering and building relationships with distributors who can rush items when needed.
The system falls apart if your ticket tracking is inconsistent. If different mechanics code repairs differently, or if tickets aren't entered promptly, your data becomes garbage. Fix your tracking discipline before trying to forecast from it.
This also assumes relatively stable business conditions. If you're planning major changes - adding e-bike service, dropping certain brands, moving locations - the historical patterns become less useful. You'll need to rely more on judgment until new patterns establish.
Turning Forecasts into Operating Rhythm
Once your forecasting system runs for a few months, it starts driving other operational improvements. You begin scheduling mechanics based on predicted service volume, not just "feels busy lately." You time marketing campaigns around inventory availability instead of arbitrary calendar dates.
The forecast becomes a communication tool between service and retail. Service manager sees tube replacements trending up? That's a signal to the retail team to promote tire upgrades and flat prevention products. Retail seeing lots of new bike sales? Service can predict the first-service wave coming in 4-6 weeks.
Your ordering rhythm smooths out. Instead of panic orders and long droughts, you're placing consistent, predictable orders that vendors love. This often unlocks better pricing, priority allocation during shortages, and improved payment terms. Distributors prefer predictable partners.
Staff training gets more strategic. If you know suspension service demand spikes in March, you send someone for suspension training in January, not scrambling to figure it out when customers are already waiting. You can schedule your slowest mechanic for vacation during your busiest predicted weeks without feeling guilty.
Even customer communication improves. When you know busy periods are coming, you can set expectations proactively. "Hey, just a heads up that our typical spring service turnaround is 4-5 days, but if you book now for February, we can guarantee 48-hour turnaround." Customers appreciate the transparency and you smooth out the demand spike.
The psychological benefit might be the biggest win. Instead of constantly reacting and feeling behind, you're working from a plan. Sure, the plan needs constant adjustment, but it's way less stressful than pure chaos. Your team feels more professional, customers get better service, and you actually enjoy running the shop again.
From Chaos to Confidence
That Boulder shop owner who stared at $47,000 in dead inventory? He implemented a version of this system the following year. Not perfectly - he missed some patterns and over-adjusted others. But his dead inventory dropped to under $12,000 while his stockouts decreased by roughly 60%.
More importantly, he stopped dreading the seasonal transitions. Spring prep became a checklist execution instead of a guessing game. Fall inventory reduction felt controlled instead of desperate. The shop ran smoother, customers got what they needed, and the stress level dropped noticeably.
The framework isn't magic. It's just systematic attention to information you already have. Every repair ticket tells you something about future demand. Every weather pattern creates predictable behavior. Every local event drives specific needs. Stack these signals together, track them consistently, and adjust regularly.
You don't need fancy software to start this process. A clipboard and consistency will get you 80% of the way there. Once you see the patterns and realize how much better your operation runs with decent forecasting, then you can think about tools that automate the tracking and pattern recognition.
The shops that thrive aren't necessarily the ones with the best mechanics or the prettiest retail floors. They're the ones that run like clockwork because they've figured out their patterns and plan accordingly. Your repair tickets are trying to tell you those patterns every single day. Maybe it's time to start listening.
Ready to revolutionize your bike shop operations?
Join hundreds of bike shops using Bicyclly to save time, increase revenue, and deliver exceptional customer service.