



Most bike shops don't have a margin problem. They have a visibility problem that shows up as a margin problem four months later.
The pattern goes like this. The year-end P&L says gross margin was around 38%. Fine. But that single number is hiding a shop where high-end bike sales barely cover the floor space they sit on, service is quietly carrying the whole operation, and the accessory wall — the thing everyone ignores — is throwing off contribution that would make a distributor jealous. When you can't see which service, which channel, and which product line is actually contributing after its own direct costs, you make decisions that feel smart and slowly bleed you.
This is about building a contribution model that maps real ticket data — parts usage, labor hours, line-item revenue — into levers an owner can actually pull: discount limits, staffing decisions, where the next dollar of investment goes. Not a textbook definition. A working model.
Why gross margin lies to you
Gross margin blends everything. Contribution margin separates it. That's the entire game.
Gross margin tells you revenue minus COGS across the whole shop. Contribution margin asks a sharper question: for this specific thing — a tune-up, a wheel build, an e-bike sale, an online parts order — what's left after the costs that only exist because you did that thing?
The distinction matters because bike shops are actually three or four businesses wearing one trench coat. New bike retail (low margin, high ticket, slow turn). Parts and accessories (high margin, small ticket, fast turn). Service (labor-driven, wildly variable). Each one behaves differently. Blending them into a single gross margin number is like averaging your fastest and slowest mechanic and calling it "shop speed."
What tends to happen across a lot of shops: the owner feels rich when bike sales are strong and feels poor in the off-season — when service was the steady contributor the whole time and bike retail was mostly moving cash around without adding much to the bottom line.
The contribution-by-service matrix
Start with service, because it's where the model pays off fastest and where the data already lives in your tickets.
Never miss a sale or service appointment again.
Bicyclly helps you manage every sale, repair, and booking with ease and accuracy.
- Unified inventory and sales tracking
- Automated customer notifications
- Service appointment scheduling
No credit card required
Build a grid. Rows are your service types. Columns are: average revenue, direct parts cost, labor hours, fully-loaded labor cost, and contribution per job. The point is to see which jobs punch above their weight — not by revenue, but by contribution per bay-hour, because bay-hours are your real constraint.
A realistic example for a mid-size shop:
| Service | Avg Revenue | Parts Cost | Labor Hrs | Labor Cost | Contribution | Contribution/Bay-Hr |
|---|---|---|---|---|---|---|
| Flat / quick fix | $22 | $8 | 0.3 | $9 | $5 | ~$17 |
| Basic tune-up | $85 | $12 | 1.0 | $30 | $43 | ~$43 |
| Full tune-up | $150 | $28 | 1.8 | $54 | $68 | ~$38 |
| Wheel build | $120 | $15 | 2.5 | $75 | $30 | ~$12 |
| Drivetrain replace | $210 | $95 | 1.5 | $45 | $70 | ~$47 |
| Suspension service | $180 | $40 | 2.0 | $60 | $80 | ~$40 |
Track contribution per bay-hour weekly so scheduling decisions reflect current capacity, not last month’s averages.
Look at that last column. The full tune-up brings in more revenue than the basic, but the basic contributes more per bay-hour because it's faster. The wheel build looks like a decent ticket at $120 and is actually one of your worst uses of a bay — 2.5 hours for $30 of contribution. A shop chasing "big tickets" would prioritize exactly the wrong work.
Revenue ranking and contribution-per-hour ranking almost never match. When you schedule and price off revenue, you overload your bays with jobs that feel important and starve the ones that quietly pay the rent. If you haven't nailed down the labor times and parts lists behind these jobs yet, that groundwork is covered in how to price a tune-up and an overhaul to hit target margins.
Margin waterfalls: where the money actually leaks
A contribution matrix tells you the steady state. A margin waterfall tells you what happened to a specific job or period between the price you quoted and the contribution you kept.
Think of it as a step-down. Start with quoted revenue, then subtract each real-world leak until you reach actual contribution:
-
Quoted price — what the menu says
-
Discounts given — the "I'll take care of you" adjustments mechanics make at the counter
-
Actual parts used vs. estimated (the extra cable, the second brake pad, the "while I was in there")
-
Actual labor hours vs. booked hours (the job that ballooned)
-
Comebacks and warranty rework — the free re-do that eats a whole slot
-
Landed contribution
When you run this on a month of tickets, the leaks are rarely where owners guess. It's almost never one big discount. It's the drip: a $10 courtesy adjustment here, twenty extra minutes there, a comeback every couple weeks. A shop doing roughly 330 service tickets a month with an average $8 unbudgeted leak per ticket is walking past close to $2,600 a month in contribution — most of which never shows up as a line item anywhere.
The mistake pattern is consistent: shops obsess over parts markup — a fixed, known number — and completely ignore the labor-hour and discount leaks, which are variable, invisible, and usually bigger. Your waterfall makes the invisible stuff visible.
Channel vs. service P&L interplay
The channels aren't separate — they feed each other, and a naive P&L punishes the wrong ones.
A common trap: an owner runs a channel P&L, sees that online parts sales carry thin margin after shipping and listing fees, and pulls back. What that P&L misses is that the online order often pulls a service booking or an in-store accessory attach behind it. The channel that looks weak in isolation is actually a customer-acquisition engine feeding the channel that prints contribution.
The reverse happens too. New-bike retail looks like a hero on the revenue line, but once you load floor space, financing costs, assembly labor, and the discount you gave to close the deal, contribution can land near zero. You keep the bikes because they bring people through the door who buy service and accessories. That's a legitimate strategic loss-leader — but only if you've measured it. A lot of shops carry loss-leaders they think are strategic that are actually just losses.
The way to hold this straight is a shared-cost interplay view: which channel originates the customer, and which channel captures the contribution. When you can see that online parts originate a meaningful chunk of your service bookings, you stop treating them as a low-margin nuisance. Deciding where inventory should physically live to serve those channels is its own exercise — worked through in when to move stock between channels.
Worth sitting with: contribution should be measured at the customer journey level, not the transaction level. A shop that optimizes each channel in isolation will slowly amputate the parts of itself that feed the profitable parts.
Worked scenario: a shop cleaning up its discount policy
Business: A single-location shop, three mechanics, roughly $850k annual revenue, split about 45% bikes / 30% service / 25% parts & accessories.
The problem: Off-season felt tight every year despite "good" gross margin. The owner assumed it was seasonality and priced bikes more aggressively to move units — which made the following spring even tighter.
When they ran a contribution matrix and a discount waterfall across three months of tickets, two things surfaced. Mechanics were discounting service far more than anyone realized — small courtesy adjustments averaging around $12 a ticket, adding up to roughly $3,800 a month in lost service contribution. And the aggressive bike discounting to "move units" was pushing new-bike contribution to near zero and eating the cash they needed for parts restock.
What changed: They set a hard discount floor on service — nothing below a target contribution-per-hour without manager sign-off — stopped competing on bike price and instead bundled a first-year service plan into each sale, and reweighted the schedule toward the high-contribution-per-bay-hour jobs the matrix flagged.
The outcome: Over the following two quarters, service contribution recovered most of that leak. The off-season didn't feel like a cliff. Revenue barely moved. Contribution moved a lot. That's the whole point — the number that pays you isn't the number on the sales report.
Turning the model into triggers
A model you look at once is a report. A model tied to triggers is an operating system. The value is in pre-deciding what a number means before emotion gets involved.
-
Discount trigger any job or sale that would drop below its target contribution-per-hour needs manager approval — no counter-level courtesy discounts on high-value work.
-
Staffing trigger when high-contribution service categories are booked out more than a set number of days, that's the signal to add mechanic hours — not a raw booking count, which can be full of low-contribution flats.
-
Investment trigger the next capital dollar (a new bay, a wheel-truing stand, more accessory space) goes to the category with the highest contribution-per-constraint-unit, not the highest revenue.
-
Menu-pruning trigger any service consistently landing at the bottom of your contribution-per-bay-hour ranking gets re-priced, re-scoped, or you accept it deliberately as a relationship service.
-
Channel trigger when a "weak" channel's origination value — the bookings and attaches it feeds — exceeds its standalone loss, you protect it instead of cutting it.
These steps look obvious written down. In real operations the hard part is keeping the data clean enough that the triggers fire on truth. If your ticket line items, parts usage, and labor times aren't captured consistently, every number above turns to mush. Getting tickets to flow into clean, reconciled numbers is the foundation everything else sits on — that plumbing is walked through in turning tickets into clean books.
This is also where connected operational software earns its keep quietly — not by being clever, but by capturing actual parts-per-ticket, actual labor hours, and discounts automatically, so the waterfall and matrix build themselves instead of living in a spreadsheet you update twice a year and eventually stop trusting.
A simple workflow for these triggers might look like this.
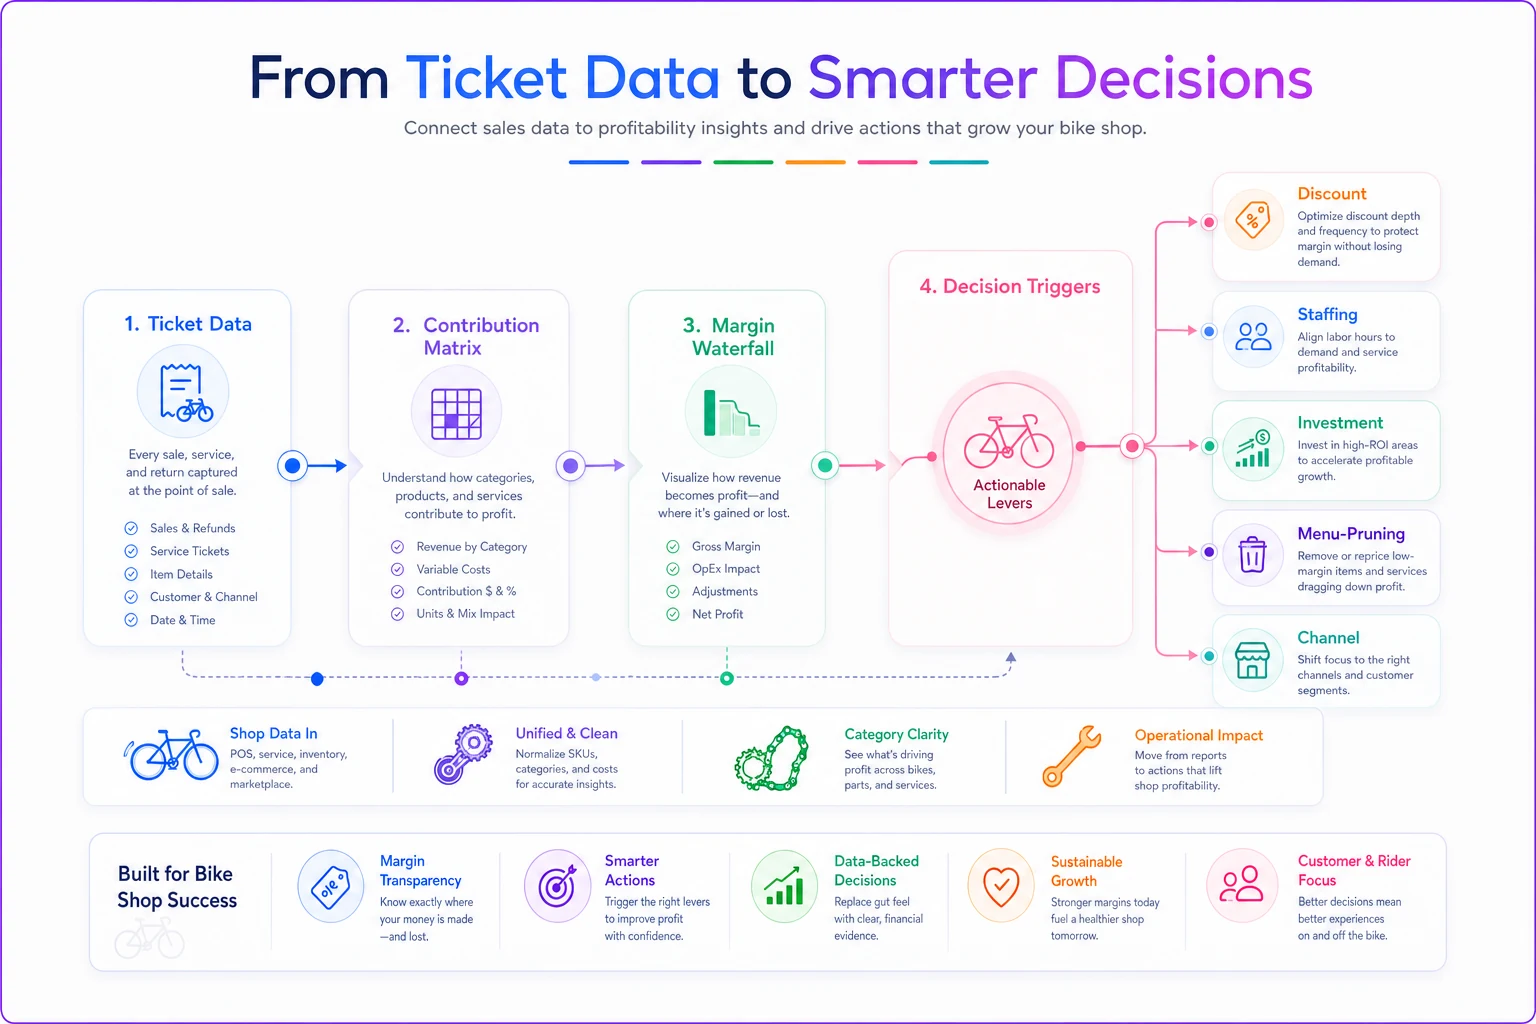
This is also where connected operational software earns its keep quietly — not by being clever, but by capturing actual parts-per-ticket, actual labor hours, and discounts automatically, so the waterfall and matrix build themselves instead of living in a spreadsheet you update twice a year and eventually stop trusting.
When this model is worth building — and when it isn't
When it makes sense: You've got at least two real revenue engines — service plus retail, for example — enough ticket volume that patterns are stable, and you're making pricing or staffing calls off gut feel that keep surprising you. If you're regularly asking "why was that month tight?" this model answers it.
When it's overkill: A brand-new, single-mechanic shop doing a handful of tickets a day. The variance is too high for the averages to mean much, and the owner already sees every job personally. Build the habit of tracking parts and labor per ticket now, but don't build the full matrix until you have the volume to make it honest.
Who should not do this: Anyone tempted to use it as a blunt cost-cutting tool. If you strip out every low-contribution service without asking what it feeds, you'll gut the relationship work and slow-day filler that keep the shop's reputation and door-count alive. The model is for seeing the whole system — not for pretending every job has to justify itself in isolation.
The bigger point
Bike shops get blindsided by their own finances not because of bad math, but because the shop is several businesses stitched together and the P&L flattens them into one number that hides which parts are carrying which. Contribution modeling un-flattens it.
Once you can see contribution by service, watch it leak through a waterfall, and understand how channels feed each other, discounting stops being a reflex, staffing stops being a guess, and your next investment goes where it actually compounds. You're not working with a bigger number. You're working with a truer one — and that's the difference between a shop that survives its off-seasons and one that just endures them.
You're not working with a bigger number. You're working with a truer one — and that's the difference between a shop that survives its off-seasons and one that just endures them.
Ready to revolutionize your bike shop operations?
Join hundreds of bike shops using Bicyclly to save time, increase revenue, and deliver exceptional customer service.