
Most bike shop owners spend the last three days of each month digging through service tickets, counting parts bins, and trying to figure out if they actually made money. The accounting software says one thing, the ticket system says another, and somehow there's $8,000 worth of parts that exist in the shop but nowhere in the books.
Why Most Bike Shop Finances Are a Mess by Month-End
The problem isn't just messy bookkeeping. When your chart of accounts doesn't match how work actually flows through your shop, you're making decisions blind. You think service is profitable because labor revenue looks good, but you're not tracking that mechanics grabbed $400 in parts from retail inventory. You think that $12,000 parts order was too big, but half of it went straight into repair jobs that billed out at 2.5x markup.
Standard bookkeeping categories weren't designed for businesses that blend retail sales, service labor, and parts inventory into every transaction. A tune-up isn't just labor—it's labor plus cables, housing, and brake pads pulled from three different inventory categories. A new bike sale includes assembly labor that should hit your service P&L, not retail margins. That mismatch is where the confusion starts and where money quietly disappears.
Why Bike Shops Need Different Accounting Architecture
Standard retail accounting assumes clean transactions: buy product, sell product, track margin. Service business accounting assumes labor-only billing with maybe some materials. Bike shops operate in the mess between those two models. Every repair ticket touches inventory. Every bike sale includes service work. Parts move between retail floor stock and the service bay all day long.
Never miss a sale or service appointment again.
Bicyclly helps you manage every sale, repair, and booking with ease and accuracy.
- Unified inventory and sales tracking
- Automated customer notifications
- Service appointment scheduling
No credit card required
The shops that actually understand their finances have rebuilt their chart of accounts around how work flows, not how QuickBooks suggests. They track parts consumption separate from parts sales. They allocate labor costs to both service tickets and bike assembly. They can tell you the real margin on an $89 tune-up after parts, labor, and overhead—not just what it looks like at the top line.
Inventory valuation chaos Parts sitting in service bins aren't counted as inventory but haven't been expensed either. They're in accounting limbo. Meanwhile, parts pulled for repairs get logged as retail shrinkage instead of service COGS. By month-end, your inventory valuation is off by thousands, making both your balance sheet and P&L unreliable.
Labor allocation blindness When mechanics spend two hours assembling a new bike, that labor usually gets buried in general payroll expense. But that's a direct cost against that bike sale—probably $50–80 that should reduce your retail margin calculation. Same mechanic spending an hour on warranty work that pays zero? That needs different treatment than billable service hours.
Category profit distortion Without proper allocation, service looks incredibly profitable while retail looks weak. This leads to bad decisions like cutting retail floor space to expand service, without realizing retail drives a significant chunk of service demand—bike sales feed tune-ups.
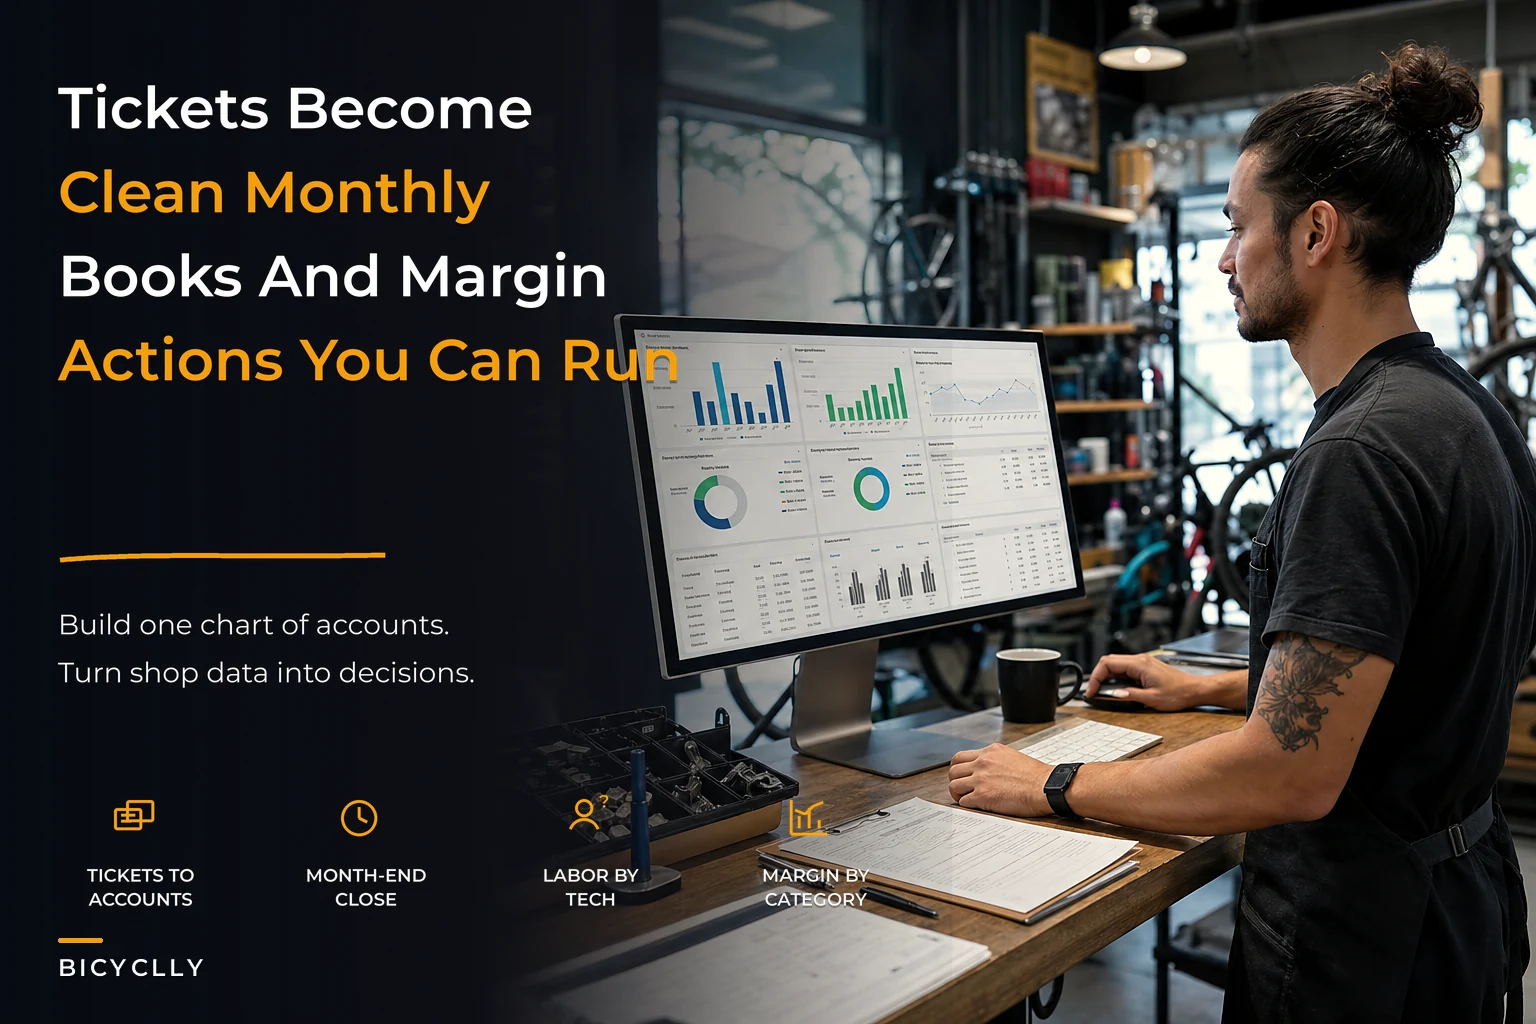
The Chart of Accounts That Actually Works
Instead of fighting standard categories, build accounts that mirror shop reality. This isn't about creating hundreds of sub-accounts—it's about the right 30–40 that actually capture what matters.
-
Retail floor stock (bikes and accessories for direct sale)
-
Service parts inventory (consumables primarily for repairs)
-
Special order/allocated inventory (parts already assigned to tickets)
This separation lets you track turns differently. Retail floor stock might turn 4x yearly, service parts much faster, while special orders shouldn't sit at all.
Revenue accounts need similar logic:
-
Bike sales (units)
-
Retail accessories (add-ons and floor sales)
-
Service labor (billed hours)
-
Service parts (markup on consumed parts)
-
Assembly/setup fees (separated from bike unit price)
With that structure, a $2,000 bike sale breaks into $1,850 bike revenue, $100 assembly fee, and $50 in accessories—each carrying different margin profiles. That distinction matters when you're trying to understand what's actually driving profit.
For cost tracking:
-
Retail COGS (purchase price of sold units)
-
Service parts consumed (parts used in repairs)
-
Direct labor – service (hourly cost for billed work)
-
Direct labor – assembly (hourly cost for bike prep)
-
Indirect labor (shop maintenance, inventory management)
Labor isn't one bucket. Billable service hours, bike assembly, and general shop work have completely different economic impacts on your business.
Building the One-Page Bike Shop Inventory Accounting Dashboard
Forget 15-page financial reports. A bike shop owner needs five key metrics visible daily, with drill-down available when something looks off. The dashboard that actually gets used fits on one screen.
Here's a simple workflow showing how ticket, POS, and inventory data feed a one-page dashboard.
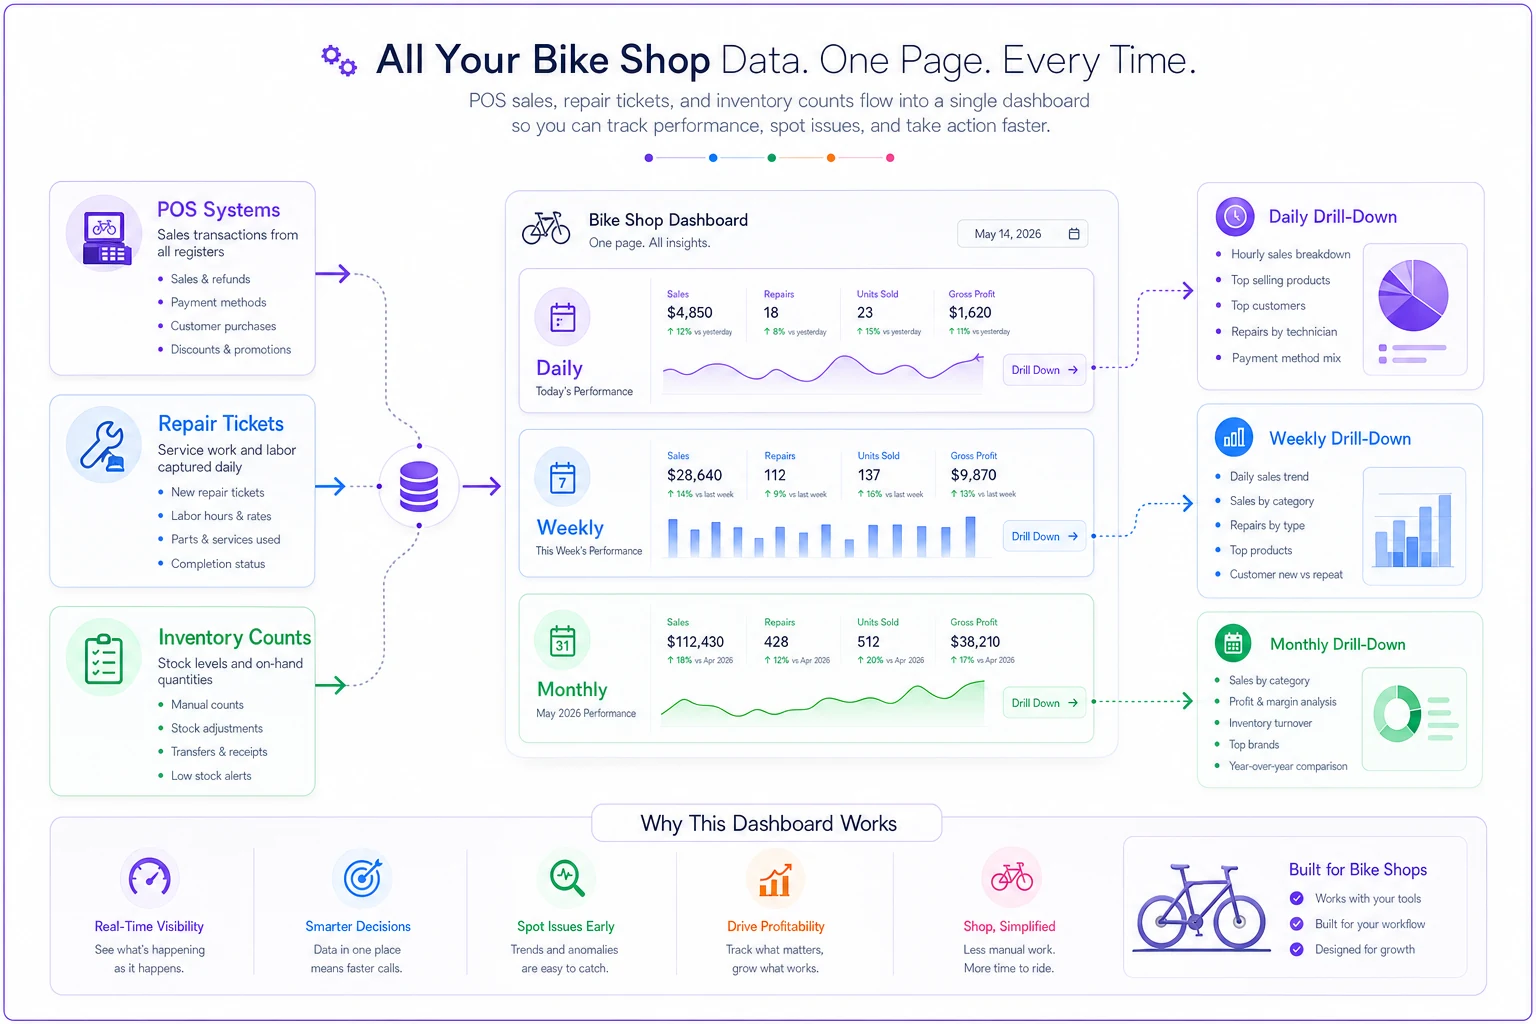
Top section: Daily Pulse Metrics
-
Service tickets completed today (with parts pulled value)
-
Bikes assembled/delivered (with assembly labor hours)
-
Current special order value awaiting pickup
-
Parts received but not put away (receiving backlog)
These four numbers tell you whether workflows are flowing or backing up. When special orders climb above $5,000, cash is getting tied up. When receiving backlog hits 20+ boxes, counting accuracy degrades fast.
Middle section: Weekly Inventory Movement
| Category | Starting Value | Purchases | Sales/Consumed | Adjustments | Ending Value |
|---|---|---|---|---|---|
| Retail Bikes | — | — | — | — | — |
| Service Parts | — | — | — | — | — |
| Retail Accessories | — | — | — | — | — |
Track retail bikes separately from parts. Track service consumables separately from retail accessories. This view immediately shows if one category is bloating while another starves.
Bottom section: Monthly Margin Reality
| Category | Revenue | Direct Costs | True Margin | Target |
|---|---|---|---|---|
| Bike Sales | $28,000 | $19,600 | 30% | 35% |
| Retail Accessories | $8,500 | $5,100 | 40% | 45% |
| Service Labor | $12,000 | $4,800 | 60% | 65% |
| Service Parts | $3,200 | $1,280 | 60% | 65% |
Labor allocation lives inside direct costs. That 30% margin on bikes includes assembly labor. The 60% on service labor accounts for unbilled warranty time. These numbers reflect reality, not accounting fiction. The dashboard matters most when it drives a consistent monthly routine—not just when someone feels like checking in.
The Monthly Decision Routine That Connects Tickets to Financials
Most shops generate reports and file them. The shops actually making money run a monthly routine that turns numbers into actions. Here's what that looks like in practice:
-
Day 1–3
Ticket and Inventory Reconciliation
— Pull every service ticket from the previous month. Match parts consumed against inventory decreases. This isn't about perfection—it's about finding the $500+ discrepancies that point to process breaks. Maybe mechanics are grabbing parts without logging them. Maybe service writers are discounting without documentation. Run a physical count on your top 20 SKUs by value. These probably represent around 40% of inventory value but only a fraction of the counting effort. Compare against system counts. Variances over 5% point to theft, miscounting, or system entry errors—all fixable once you can see them. -
Day 4–5
Labor Analysis
— Calculate actual hourly margins by mechanic. Take billed hours times shop rate, subtract actual hours worked times wage cost. If your senior mechanic bills 120 hours but worked 160, that's 75% efficiency—might be acceptable for complex repairs but painful if they're spending that time on basic tune-ups. Check assembly time against assembly fees collected. If you charge $60 for assembly but mechanics average 1.5 hours at $25/hour cost, you're netting $22.50 before overhead. Either raise the fee or tighten the process. -
Day 6–7
Category Performance Decisions
— Compare margins against targets, but don't stop at percentages—look at absolute dollars. Service might have strong margins, but if volume is low, a small margin drop in bikes could hurt more. Check parts turnover by category. Chains turning 2x yearly while brake pads turn 8x suggests an inventory balance problem worth addressing. -
Day 8–10
Pricing and Purchasing Adjustments
— Review your pricing on core services against actual costs including parts consumption. If tune-ups consume $12 in parts on average and you're not accounting for that, your $89 tune-up might only net $30 after labor and parts. Adjust reorder points based on consumption patterns from tickets. If 35 of the 40 tubes you moved last month went into repairs rather than retail sales, your reorder trigger should reflect service consumption rates, not retail movement.
Running this routine consistently is what separates shops that understand their numbers from shops that just have numbers.
Common Profit Leaks That Better Tracking Exposes
Once shops implement proper ticket-to-books tracking, the same profit leaks tend to surface.
The warranty time sink Shops doing warranty work for brands often don't track the real cost. They submit for a $40 reimbursement but don't calculate that the repair took 1.5 hours of mechanic time worth $37.50, plus $8 in small parts not covered. That $40 warranty job actually cost $5.50. Multiply by 20 monthly warranty tickets and you're losing over $100 that shows up nowhere in standard reports.
Parts walking between departments A mechanic needs a derailleur hanger for a repair. None in service inventory, so they grab one from retail. The transfer never hits the system. Retail shows shrinkage, service shows impossible margins, and the real profitability of both departments becomes fiction.
Assembly labor buried in overhead Many shops treat all mechanic time as overhead, then wonder why bike sales look profitable while cash stays tight. When you properly allocate assembly labor to bike COGS, that $400 margin on a bike becomes $320 after assembly. Still fine—but now you understand why selling 10 more bikes didn't fix cash flow.
Special order purgatory Without tracking, special orders accumulate quietly. Thousands in parts ordered for customers who never showed up, tying up cash and shelf space. When special order value starts exceeding a week of typical sales, you've got a collection problem. A dashboard makes it obvious before it turns into a cash crisis.
Software That Bridges Tickets to Accounting
Manual reconciliation works for a month or two, then falls apart. The data lives in too many places—POS system, repair tickets, QuickBooks, inventory counts. Shops that sustain this long-term have systems connecting these automatically.
Modern bike shop management platforms can map service tickets directly to accounting categories. When a mechanic logs parts used, the system moves those costs from inventory to service COGS automatically. When they complete a bike assembly, labor hours flow to the right cost category without anyone manually coding it. The operational structure for high-throughput shops depends on this kind of automation running underneath everything else.
AI-powered platforms take it further. They surface patterns that are easy to miss manually—like Tuesday tune-ups consistently consuming more parts than other days, or a specific mechanic's ticket close rate dropping over three weeks. They flag when special order accumulation points to a process break before it becomes a cash flow problem. They suggest reorder points based on actual consumption from tickets, not theoretical turnover rates.
But automation doesn't mean abdication. The best systems make problems visible, not invisible. They surface the $200 discrepancy that needs investigation rather than burying it in automated adjustments. You still have to look at the numbers—the tool just makes sure you're looking at the right ones.
When Rebuilding Your Accounting Makes Sense (and When It Doesn't)
Not every shop needs this level of tracking. At $300k yearly with one mechanic and mostly retail sales, basic QuickBooks categories probably suffice. The complexity isn't worth the insight at that scale.
Around $600k revenue with two or more mechanics and a real mix of retail and service, the standard approach breaks down. You're making too many decisions blind. The time spent monthly reconciling tickets to books saves thousands in better inventory and pricing decisions.
Shops over $1M revenue without this structure are almost certainly leaving money on the table—probably somewhere in the 5–8% range across aggregate inefficiencies. Wrong inventory mix, underpriced labor, hidden warranty losses, poor parts allocation. It compounds fast and quietly.
The transition takes roughly a month. Week one: rebuild chart of accounts. Week two: train staff on new coding. Week three: run parallel with the old system. Week four: cut over and start the monthly routine. Most shops find problems immediately that had been hiding for years—which is uncomfortable but useful.
Making the Dashboard Stick
Building the dashboard is easy. Making it part of daily operations is harder. The shops where it actually sticks tend to share a few traits.
They keep it simple. Not 50 metrics—just the 5–8 that matter. Service tickets, inventory value, labor efficiency, margin by category. Everything visible on one screen, updated automatically.
Keep the morning huddle under three minutes and focus on anomalies, not a full metric review.
They tie it to daily huddles. Every morning, two minutes reviewing yesterday's numbers. Not deep analysis—just pattern recognition. Tickets down three days straight? Parts consumption up 20%? These patterns trigger investigation before they become problems.
They connect metrics to compensation. When service writers see how parts attachment affects margin, and margin affects their bonus, behavior changes. When mechanics understand how efficiency metrics work, they self-optimize. The dashboard becomes their scorecard, not a management surveillance tool.
The Profit Clarity That Changes How You Operate
A bike shop running proper ticket-to-accounting integration operates differently. They know a $2,000 bike sale actually generates closer to $2,180 in total revenue when you include assembly, accessories, and the tune-up six months later. They know that $89 tune-up nets around $42 after parts and labor, making volume more important than price.
They catch problems early. When parts consumption per ticket rises 15%, they investigate immediately—finding either a process break or a pricing opportunity. When special orders exceed normal levels, they run collection procedures before cash flow tightens.
Most importantly, they make decisions with confidence. They know whether to expand service or retail. They know which categories deserve inventory investment. They know when a "profitable" service is actually losing money after proper allocation.
The bike shop inventory accounting dashboard isn't about perfect books—it's about operational clarity. When tickets flow cleanly into financials, when parts consumption maps to service margins, when labor allocation reflects reality, you stop managing by gut feel. Most shops discover they're less profitable than they thought in some areas, more profitable in others. But knowing beats guessing.
Once you know where money really comes from and where it disappears, fixing it becomes a straightforward operational adjustment rather than a financial mystery. The shops thriving in competitive markets aren't necessarily better at selling bikes or fixing them—they're better at understanding the economics of each transaction, each ticket, each parts pull. They've turned their monthly scramble into a clean routine that takes hours, not days, and their dashboard tells them what's working, what's breaking, and what needs attention before it shows up as a cash crisis.
Ready to revolutionize your bike shop operations?
Join hundreds of bike shops using Bicyclly to save time, increase revenue, and deliver exceptional customer service.