



Most bike shops track parts inventory wrong. They count what's on the shelf. They know when to reorder chains and brake pads. But they're completely missing the economics of consumable parts—the stuff mechanics burn through that never shows up on customer invoices but absolutely kills your margins.
Cable housing cut for every shift cable replacement. Chain pins that go straight into the trash after every install. Brake fluid that gets spilled or overfilled. Spoke nipples that roll off the bench and disappear. These parts have real bike shop parts lifecycle TCO that most owners never sit down and calculate.
The problem gets worse when you realize your mechanics use these parts at wildly different rates. One tech might stretch a box of cable ferrules across 40 installations. Another burns through them in 25. Without tracking actual wear rates, you're guessing on both reorder timing and service pricing.
Why Standard Parts Calculators Fall Apart in Real Shops
Shop owners typically rely on manufacturer recommendations or industry averages to estimate parts usage. Chain manufacturers say a chain lasts 2,000–3,000 miles. Brake pad companies claim 1,500 miles for organic compounds. Cable housing supposedly stays good for a year.
These numbers mean nothing in your actual shop.
A customer commuting through winter slush destroys chains in 800 miles. Weekend warriors on carbon bikes might stretch a chain to 4,000. That teenager doing tricks in the parking lot? Brake pads are gone in three weeks. The variability makes standard lifecycle tables nearly useless for operational planning.
The bigger issue is consumables that mechanics control directly. When you quote a derailleur adjustment, you're assuming minimal parts usage—maybe a cable end cap, possibly a ferrule. But if your mechanic decides the housing looks sketchy and replaces a section, or messes up cable tension and reruns the whole thing, your parts cost just tripled. The customer pays the same labor rate either way.
This gap between quoted price and actual parts consumption is where margin quietly bleeds out. You think you're making $35 on a brake bleed. After fluid waste, bleed kit wear, cleaning supplies, and the occasional stripped bleed screw, you might be netting $18. Multiply that across hundreds of services and you're leaving serious money behind.
Building Your Shop's Actual Wear Rate Data
Forget manufacturer specs. You need real data from your actual mechanics working on your actual customer base.
Never miss a sale or service appointment again.
Bicyclly helps you manage every sale, repair, and booking with ease and accuracy.
- Unified inventory and sales tracking
- Automated customer notifications
- Service appointment scheduling
No credit card required
Start with a mechanic wear survey. Give each tech a clipboard for one week. They write down every consumable they pull—not what gets billed, but what actually leaves inventory. Cable housing by the inch. Number of ferrules. End caps. Zip ties. Electrical tape. Every chain pin, every nipple, every drop of threadlocker.
Keep the tracking sheet simple:
Monday - Tech: Mike
-
Shift cable job #1
8" housing, 2 ferrules, 1 end cap
-
Shift cable job #2
14" housing, 4 ferrules, 2 end caps, had to redo
-
Brake bleed
60ml fluid (40ml system + 20ml waste)
-
Wheel true
3 nipples (1 stripped, 2 replacements)
One week of data shows you patterns fast. Mike averages 11 inches of housing per shift cable. Sarah uses 9 because she's more precise. Tom somehow uses 15—turns out he's been replacing full runs when only the ends are frayed.
Component Lifespan Tables Built from Shop Reality
Once you have wear data, build your own lifespan tables. Here's what shop-level data typically looks like:
| Component | Manufacturer Spec | Shop Reality | Variance Factor |
|---|---|---|---|
| Derailleur cable | 2,000 miles | 1,200 miles | Weather/storage dependent |
| Brake cable | 2,500 miles | 1,400 miles | Brake type matters |
| Chain (9-speed) | 2,500 miles | 1,800 miles | Maintenance varies wildly |
| Chain (11-speed) | 2,000 miles | 1,100 miles | Higher precision = faster wear |
| Brake pads (rim) | 1,500 miles | 900 miles | Commuters burn through faster |
| Brake pads (disc) | 2,000 miles | 1,300 miles | Depends on rotor condition |
| Bar tape | 1 year | 7 months | Sweat is the killer |
| Cable housing | 2 years | 14 months | UV damage in display bikes |
The real insight comes from consumables:
| Consumable | Usage per Service | Monthly Services | Monthly Consumption |
|---|---|---|---|
| Cable ferrules | 2.3 per cable job | 45 cable jobs | 104 ferrules |
| Cable end caps | 1.8 per cable job | 45 cable jobs | 81 caps |
| Chain pins | 1.2 per chain install | 28 chain installs | 34 pins |
| Brake fluid | 55ml per bleed | 15 bleeds | 825ml total |
| Electrical tape | 14" per wrap job | 60 wrap jobs | 70 feet |
| Zip ties (small) | 3.5 per bike | 85 services | 298 ties |
These numbers tell you when to reorder. If you're burning through 104 ferrules monthly and they come in boxes of 500, you need a new box every 4–5 months. Set your reorder point at 150 remaining and you'll never run out mid-repair.
Converting Wear Rates to Reorder Triggers
The math for reorder points gets more interesting when you factor in supplier lead times and service seasonality. Most shops see volume spike in spring, plateau through summer, then fall hard in winter. Consumable usage follows the same curve.
Take brake fluid. Summer might see 20 bleeds and 1,100ml of usage. January drops to 8 bleeds and maybe 440ml. Ordering monthly with fixed reorder triggers gets sloppy fast.
A rolling average works better. Track your last 60 days of usage, calculate daily burn rate, then multiply by lead time plus safety margin. If you're averaging 27ml of brake fluid daily and your supplier takes 5 days to deliver, you need at least 135ml on hand when you place the order. Add a 50% buffer for busy weeks and your reorder trigger is around 200ml remaining.
Same logic applies across every consumable. Build a simple spreadsheet:
-
Column A
Part name
-
Column B
60-day usage total
-
Column C
Daily burn rate (B ÷ 60)
-
Column D
Supplier lead time in days
-
Column E
Reorder point (C × D × 1.5)
Update usage totals weekly and your reorder points adjust automatically for seasonal swings. During spring rush, the numbers climb. Slow winters, they drop. You're always carrying the right amount without tying up cash in parts that'll sit for months.
True Cost Accounting for Common Services
This is where things get uncomfortable. Most shops price services based on labor time plus marked-up parts the customer sees on the invoice. Consumable costs hide in the background and quietly erode margin.
A complete brake cable replacement:
Visible costs (customer sees on invoice):
-
Brake cable
$6 wholesale, sold at $12
-
Labor
0.5 hours at $80/hour = $40
-
Total customer charge
$52
Hidden consumable costs:
-
Cable housing (18 inches average)
$0.90
-
Ferrules (4 count)
$0.32
-
Cable end caps (2 count)
$0.14
-
Cable cutter wear allocation
$0.05
-
Housing cutter wear allocation
$0.05
-
Cleaning solvent
$0.12
-
Shop rag usage
$0.08
-
Mechanic error rate (8% redo)
$0.61
-
Total hidden costs
$2.27
Your actual margin on that $52 service isn't what you think. Across 45 cable jobs monthly, you're losing around $100 in margins you assumed you had.
Hydraulic brake bleeds are worse:
What shops typically calculate:
-
Labor
0.75 hours at $80/hour = $60
-
Brake fluid markup
$5
-
Total charge
$65
Actual consumable costs:
-
Brake fluid (55ml average)
$3.30
-
Bleed kit syringe wear
$0.40
-
Bleed block wear
$0.15
-
Cleaning alcohol
$0.25
-
Nitrile gloves (2 pairs)
$0.30
-
Shop rags
$0.20
-
Waste disposal allocation
$0.15
-
Mechanic spill/error rate (12%)
$0.88
-
Total hidden costs
$5.63
You're not making $65 on that bleed. At 15–20 bleeds monthly, that's roughly $100–130 in monthly margin quietly disappearing.
Pricing Adjustments Based on Real TCO Data
Once you see true costs, you have to make a call. Some shops absorb consumable costs and accept thinner margins. Others adjust pricing. What makes sense depends on where you sit in the market.
If you're the premium shop in town, already at $85/hour labor, bumping brake bleeds to $70 probably won't lose you customers. Position it right—factory-spec fluid, professional-grade tools—and most customers who pay premium prices won't push back on a $5 difference.
If you're competing on price, absorbing consumable costs might be the play. But at least know exactly what you're giving up. When you understand that tune-ups actually cost $4.80 in consumables—not the $2 you estimated—you can make real decisions about promotional pricing. That "$39 spring tune-up special" might need to be $45 to hold margins.
The better opportunity is in service packages and maintenance bundles built around real numbers. When you know true costs, you can build packages that look like deals but actually protect margin:
"Season Prep Package" - $189
-
Full tune-up (true cost with consumables
$28)
-
Brake adjustment (true cost
$8)
-
Wheel true (true cost
$12)
-
Chain measurement (true cost
$3)
-
Safety inspection (true cost
$5)
-
Total true cost
$56
-
Customer perception
$220+ value
Customers feel like they're getting a deal. You're covering all consumable costs. Mechanics aren't rushed into skipping steps that eat materials.
Mechanic Accountability Without Micromanagement
Tracking consumable usage exposes mechanic variance. When Tom uses 60% more cable housing than Sarah, that's either a training issue or a waste problem. But you have to approach this carefully—you don't want mechanics cutting corners to save ferrules.
The better move is making consumable costs visible without making them punitive. Post a simple chart in the service area showing average usage per service type. No names, just ranges:
Shift Cable Replacement - Consumable Usage Range
-
Housing
8–15 inches (shop average: 11")
-
Ferrules
2–4 count (shop average: 2.3)
-
End caps
1–2 count (shop average: 1.8)
Mechanics naturally self-correct toward the average. Nobody wants to be the obvious outlier using twice the brake fluid as everyone else. The transparency creates gentle pressure without heavy-handed management.
For chronic over-users, look closer before assuming the worst. Tom's excessive housing usage might be because he always replaces full runs instead of sections—a quality decision that might actually reduce comeback repairs. Or he's just sloppy with measurements. Watch a few jobs first.
Consider small efficiency bonuses for mechanics who consistently hit targets. If the shop average for brake bleeds is 55ml and someone's averaging 45ml while maintaining quality, share some of the saved margin. Even $0.50 per efficient service adds up and reinforces the right habits.
Seasonal Patterns and Bulk Buying Decisions
Your wear rate data reveals seasonal patterns worth acting on. Spring is chains, cables, and brake pads. Fall brings tires and lighting. Winter is trainers and maintenance supplies.
Consumables follow slightly different patterns. Cable housing usage stays fairly consistent—bikes need cables fixed year-round. Brake fluid consumption actually tends to climb in winter as moisture contamination from temperature swings causes more bleeds. Chain pins spike in spring when everyone's replacing winter-worn drivetrains.
Use your seasonal forecasting data to find bulk buying opportunities. If you know you'll burn through 2,000 ferrules between March and August, buying a case of 5,000 in February at a 15% discount makes sense. You'll use them, and the saved margin is pure bottom-line improvement.
Be selective though. Brake fluid has a shelf life once opened. Electrical tape degrades. Zip ties get brittle. Only bulk-buy what you'll realistically use within 6–12 months and what stores well. A deal on 10,000 cable ends means nothing if half of them are still taking up shelf space two years later.
Managing Consumable Inventory Without Complexity
The challenge with tracking dozens of small consumables is keeping the system from becoming a burden. You need enough detail to manage costs without bogging down operations. Tiered tracking solves this.
Tier 1 - Track closely (high cost, high volume):
-
Brake fluid
-
Cable housing
-
Chains
-
Bar tape
-
Tire sealant
Tier 2 - Track monthly (moderate cost or volume):
-
Ferrules
-
Cable ends
-
Chain pins
-
Spoke nipples
-
Rim tape
Tier 3 - Track quarterly (low cost, low volume):
-
Zip ties
-
Electrical tape
-
Threadlocker
-
Grease
-
Chain lube samples
Focus manual tracking on Tier 1 items—it's where you'll see the biggest returns.
Tier 1 gets perpetual inventory with daily counts. Tier 2 gets weekly spot checks. Tier 3, quarterly reviews are enough. This graduated approach gives you meaningful cost control without turning inventory management into a second job.
The tracking system itself doesn't need to be fancy. A basic spreadsheet or even a paper log works fine for shops doing under 500 services monthly. Consistency matters more than sophistication—track the same way every time so your data stays usable.
When you run AI-powered operational software for inventory management, consumable tracking can become largely automatic. The system learns usage patterns, predicts reorder points, and flags unusual consumption that might indicate waste or a process problem. But even manual tracking beats nothing when it comes to understanding what services actually cost.
The Compound Effect of Consumable Cost Control
Consumable cost control seems minor compared to big-ticket inventory. The compound effect is not.
Consider a shop doing 300 services monthly:
Before consumable tracking:
-
Average hidden consumable cost per service
$3.50
-
Monthly consumable loss
$1,050
-
Annual impact
$12,600
After implementing wear-rate tracking:
-
Reduced waste through awareness
20% savings
-
Better bulk buying
15% cost reduction
-
Accurate service pricing
$2 average price increase
-
Monthly improvement
~$878
-
Annual impact
~$10,500 recovered margin
That's not revenue. It's pure margin improvement—no new customers, no expanded hours, no new equipment. Just better operational control.
The behavioral effect matters too. When mechanics understand that every ferrule costs real money, they naturally become more conscientious. Not stingy—conscientious. Measure twice, cut once. Use what's needed, nothing more.
Warning Signs Your Consumable Costs Are Out of Control
Service margins declining despite stable labor rates? Check consumable usage. If your brake bleed labor hasn't changed but margins dropped noticeably, someone's wasting fluid or you haven't accounted for rising supply costs.
Mechanics constantly running out of small parts mid-repair? Either reorder points are wrong or usage has spiked without a matching increase in service volume. Both point to a waste or process problem.
Wide variance in service times for identical repairs? When one mechanic takes 30 minutes for a cable replacement and another takes 45, the slower tech is probably redoing work—and burning through consumables in the process.
Customer complaints about nickel-and-dime charges on invoices? If consumable cost increases are forcing you to add small parts charges after the fact, customers will notice. Better to build true costs into service prices upfront.
Building Your Shop's Wear Rate System
No massive investment required. Start here:
-
Week 1
Data Collection
Run the mechanic survey. Get baseline usage data for your top 20 consumables. Don't try to track everything at once—focus on items that actually matter. -
Week 2
Analysis and Table Building
Calculate average usage rates. Build your shop-specific lifespan tables. Identify variance between mechanics. Create reorder triggers based on actual consumption. -
Week 3
Price Adjustment
Review service pricing against true costs including consumables. Adjust where margins have eroded below targets. Talk to staff about the changes before they go into effect. -
Week 4
System Implementation
Roll out the tracking system. Train mechanics on expectations. Start monitoring weekly. Set up reorder alerts based on calculated triggers. -
Month 2
Refinement
Review data quality. Adjust tracking categories if something isn't working. Fine-tune reorder points with real experience behind them. Start identifying bulk buying opportunities for stable-consumption items. -
Month 3
Optimization
Find waste reduction opportunities. Run mechanic training where variance is high. Negotiate supplier pricing based on predictable volumes. Calculate what the whole initiative has actually returned.
Here's a simple workflow to follow.
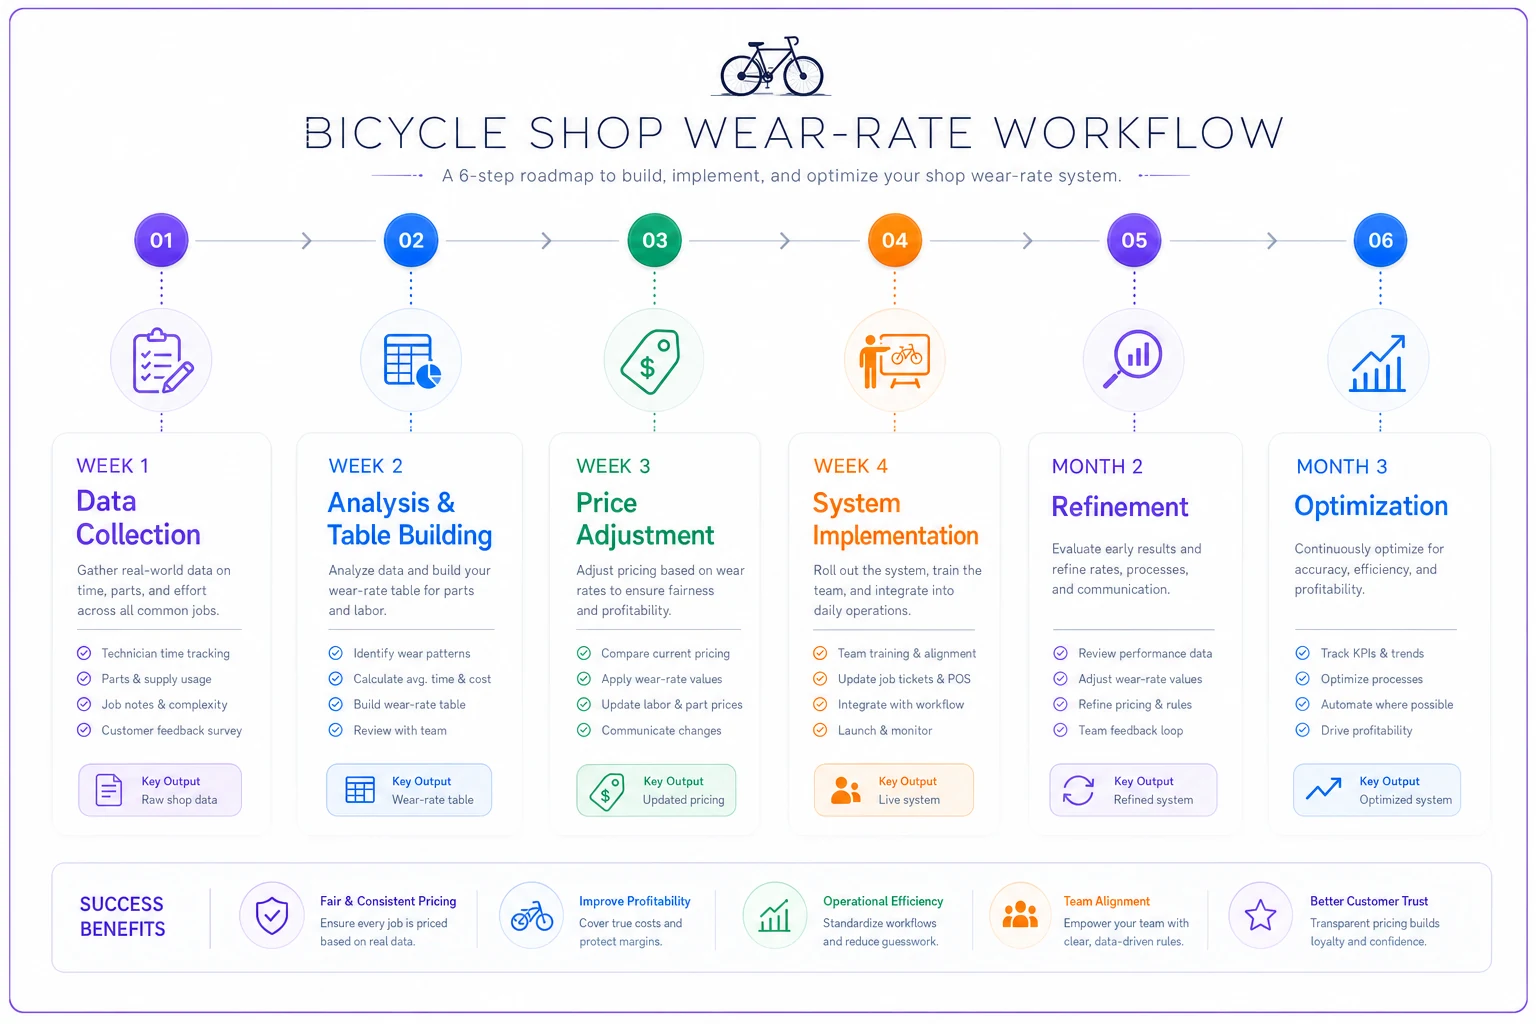
Takes about 90 days to dial in. After that, it's maintenance—weekly consumption reviews, monthly reorder adjustments, quarterly pricing analysis.
Small Parts, Big Impact
Consumable parts management isn't exciting. Nobody opened a bike shop dreaming about tracking cable ferrules. But this is exactly the kind of operational work that separates shops that build real profitability from shops that grind and wonder why margins keep shrinking.
Every ferrule wasted, every ounce of brake fluid spilled, every inch of housing cut sloppy—it compounds. Multiply small inefficiencies across hundreds of services, thousands of small parts, and multiple mechanics, and the annual impact is real money.
The shops that last aren't always the ones with the best mechanics or the coolest floor. They're the ones that understand true operational costs and build systems to manage them. They know that bike shop parts lifecycle TCO goes beyond purchase price to include waste, efficiency, reorder costs, and hidden consumption.
Start tracking consumable usage this week. Build shop-specific wear rate tables. Calculate true service costs down to every ferrule and zip tie. Adjust pricing to protect margins. Train mechanics to respect consumables without sacrificing quality.
The hour spent setting up consumable tracking pays for itself within the first month. Maintaining that discipline pays for years—because in the end, successful shop management isn't about the big wins. It's about controlling the thousand small costs that determine whether you're building something or just keeping the lights on.
Ready to revolutionize your bike shop operations?
Join hundreds of bike shops using Bicyclly to save time, increase revenue, and deliver exceptional customer service.