
Your mechanic needs a derailleur hanger for a bike sitting in the stand. The main supplier shows three weeks lead time. Your backup vendor has it for 40% more. The customer's expecting their bike tomorrow.
This scenario plays out in bike shops constantly. Not because shops don't understand inventory management, but because the traditional approach to supplier relationships breaks down when you're dealing with hundreds of SKUs, seasonal demand swings, and suppliers who treat small shops as their lowest priority.
Why Traditional Supplier Management Fails Small Shops
Most supplier scorecard systems come from manufacturing or large retail. They track metrics that sound important—on-time delivery percentage, fill rates, quality scores—but miss what actually matters for a 1,200 square foot shop trying to keep four repair bays productive.
The real operational challenge isn't tracking whether QBP delivered 94% or 96% of orders on time. It's knowing that brake pads from them typically arrive in 3-4 days while chain rings take 8-12 days, and adjusting your safety stock accordingly. It's recognizing that J&B's lead times triple during spring tune-up season but stay consistent through winter. It's understanding which suppliers will expedite a critical part versus which ones won't even answer the phone.
Small shops face a specific set of supplier challenges that generic scorecards don't address. Your purchasing power is minimal. You can't negotiate volume discounts or priority shipping. You're ordering $300 worth of miscellaneous parts, not $30,000 container loads. When a supplier bumps their minimum order from $100 to $250, it fundamentally changes your reorder math.
The complexity multiplies when you factor in repair ticket patterns. A road bike overhaul needs different parts than a mountain bike suspension service. Each service type creates its own demand pattern, its own supplier dependencies, its own stockout risks. Traditional inventory systems treat all SKUs equally, but a missing spoke nipple stops a wheel build just as surely as a missing hub.
Building a Repair-Focused Supplier Scorecard
The supplier scorecard that actually works starts with repair ticket data, not purchasing history. Look at which parts appear most frequently on tickets, which suppliers provide them, and what the actual bench-to-customer timeline looks like.
Never miss a sale or service appointment again.
Bicyclly helps you manage every sale, repair, and booking with ease and accuracy.
- Unified inventory and sales tracking
- Automated customer notifications
- Service appointment scheduling
No credit card required
Track three core metrics for each supplier-category combination. Not supplier overall, but supplier by product category—because the same distributor might be lightning-fast on tires but glacially slow on electronics.
Lead time variance by category: Track actual days from order to receipt for brake parts, drivetrain components, accessories, tools. Build separate averages for each. QBP might average 4 days on chains but 11 days on specialty tools. That variance matters more than their overall 6-day average.
Ticket delay frequency: Count how many repair tickets get delayed waiting for parts from each supplier. Weight this by ticket value. A delayed $400 suspension service hurts more than a delayed $15 flat fix. Some suppliers consistently cause high-value delays even with decent overall metrics.
Substitute availability rate: Track whether a supplier can provide acceptable alternatives when your first choice is out of stock. Can they offer a comparable chain when the exact model is backordered? Will they suggest compatible brake pads? This flexibility keeps repairs moving.
Create a simple tracking table:
| Supplier | Category | Avg Lead Time | Lead Time Range | Tickets Delayed/Month | Alt Options Available |
|---|---|---|---|---|---|
| QBP | Chains | 4 days | 2-7 days | 3 | Usually |
| QBP | Brake Pads | 3 days | 2-4 days | 1 | Always |
| J&B | Chains | 6 days | 3-14 days | 8 | Sometimes |
| J&B | Cables | 2 days | 1-3 days | 0 | Always |
| BTI | Tires | 5 days | 4-8 days | 2 | Usually |
This granular view reveals patterns that aggregate metrics hide. Maybe J&B becomes your cable specialist while QBP handles brake components. The scorecard guides these micro-decisions.
Safety Stock Rules Tied to Actual Usage
Generic safety stock formulas assume predictable demand and consistent lead times. Bike shops have neither. Your safety stock needs to account for repair ticket patterns, supplier reliability, and the real cost of stockouts.
Instead of complex EOQ calculations, use a ticket-based approach. Count how many times each SKU appeared on repair tickets over the past 90 days. Divide by 90 for daily usage. Multiply by the supplier's maximum lead time (not average) from your scorecard. Add a buffer based on the supplier's reliability score.
-
Brake pads used on 45 tickets in 90 days = 0.5 per day
-
Maximum QBP lead time for brake pads = 4 days
-
Base safety stock = 2 units
-
QBP reliability is high, so no additional buffer needed
-
Order point = 2 units
-
Same usage rate = 0.5 per day
-
Maximum lead time from secondary supplier = 9 days
-
Base safety stock = 4.5 units (round to 5)
-
Supplier has high variance, add 50% buffer
-
Order point = 8 units
This reorder methodology using repair tickets creates safety stock levels that reflect your actual operational risk, not theoretical optimization.
The key insight here: safety stock isn't about the part, it's about the supplier-part combination. The same tube might need different stock levels depending on who you're ordering from. A reliable supplier with consistent 3-day delivery needs minimal safety stock. An inconsistent supplier with 3-15 day variance needs significant buffer.
Multi-Source Decision Rules Without the Complexity
Every bike shop eventually realizes single-sourcing critical parts is operational suicide. But managing multiple suppliers for overlapping inventory creates its own problems. How do you decide when to use which supplier? How do you prevent duplicate orders? How do you track what's coming from where?
The answer isn't necessarily sophisticated software. It's clear decision rules that your team can actually follow during a busy Saturday.
Primary/secondary assignment by category: Don't make every order a complex decision. Assign primary and secondary suppliers by category based on your scorecard data. Chains come from QBP unless they're out, then BTI. Tires from BTI unless urgent, then local wholesale. These assignments live on a laminated card at the parts counter.
Keep the primary/secondary assignments on a laminated card at the parts counter.
Price threshold triggers: Set clear rules for when price overrides supplier preference. If the secondary supplier is within 15% of primary, order from whoever has it in stock. If they're 15-30% higher, use them only for repairs due within 48 hours. Over 30% markup requires manager approval or customer consent.
Consolidated ordering windows: Instead of ordering from multiple suppliers throughout the day, establish windows. QBP orders go out at 11am and 3pm. J&B at noon. BTI at 2pm. This batching reduces shipping costs and makes it easier to track what's been ordered. It also prevents the panic-ordering that happens when mechanics discover missing parts at 4:45pm.
Emergency escalation paths: Document exactly when and how to use expedited shipping, local suppliers, or competitor retail purchases. For repairs under $200, standard shipping only. For repairs $200-500, expedite if it saves the completion date. Over $500, explore all options including buying retail from competitors if necessary.
A practical multi-source matrix:
| Part Category | Primary Supplier | Secondary Supplier | Emergency Source | Price Override Threshold |
|---|---|---|---|---|
| Chains | QBP | BTI | Local wholesale | +20% |
| Cassettes | BTI | QBP | Amazon Business | +25% |
| Brake pads | QBP | J&B | Competitor retail | +30% |
| Cables | J&B | QBP | In-stock only | +15% |
| Tires | BTI | QBP | Local wholesale | +15% |
This structured approach removes decision fatigue while maintaining flexibility. Your team knows exactly what to do without calling the owner every time QBP is out of something.
The RFP-Style Lead Time Tracker
Most shops don't do this, but they should: treat your regular parts orders like mini RFPs. Not with formal documentation, but with the mindset of comparing options before committing.
When you need parts for next week's scheduled repairs, check the same list with three suppliers. Note price, availability, and promised delivery date. Five extra minutes of comparison reveals patterns you'd never notice otherwise.
-
Date requested
-
Part needed
-
QBP price/availability/lead time
-
BTI price/availability/lead time
-
J&B price/availability/lead time
-
Supplier selected
-
Actual delivery date
After 30-60 days, patterns emerge. Maybe QBP consistently beats their promised dates on drivetrain parts but runs late on tools. BTI might have better prices on paper but their shipping pushes total cost higher. J&B might surprise you with competitive pricing on items you never thought to check with them.
This tracking also gives you leverage. When your QBP rep visits, you have data: "You've been 2-3 days late on 40% of brake component orders over the past quarter." That's a different conversation than "your delivery seems slow sometimes."
The tracker becomes especially valuable during seasonal transitions. You'll notice which suppliers struggle with spring demand before it impacts your repairs. You'll see who maintains inventory during slow seasons when others let stock dwindle. This intelligence drives better ordering decisions year-round.
Connecting Scorecards to Daily Operations
The best supplier scorecard isn't a monthly report you review and file. It's a living system that drives daily decisions—and that requires integration with your actual workflows, not just your purchasing process.
When a mechanic starts a repair, they should see supplier lead times for needed parts right on the ticket. Not buried in a purchasing system, but visible where decisions happen. If that derailleur hanger shows 8-day lead time, the conversation with the customer changes immediately. No more promising Tuesday delivery then calling Thursday with bad news.
Your service writers need visibility too. When someone calls about a wheel build, the scheduler should know that spoke lead times are running 10-12 days from all suppliers. Setting proper expectations prevents the delays and scrambling that erode customer trust.
This illustrates how scorecard data flows into tickets and inventory.
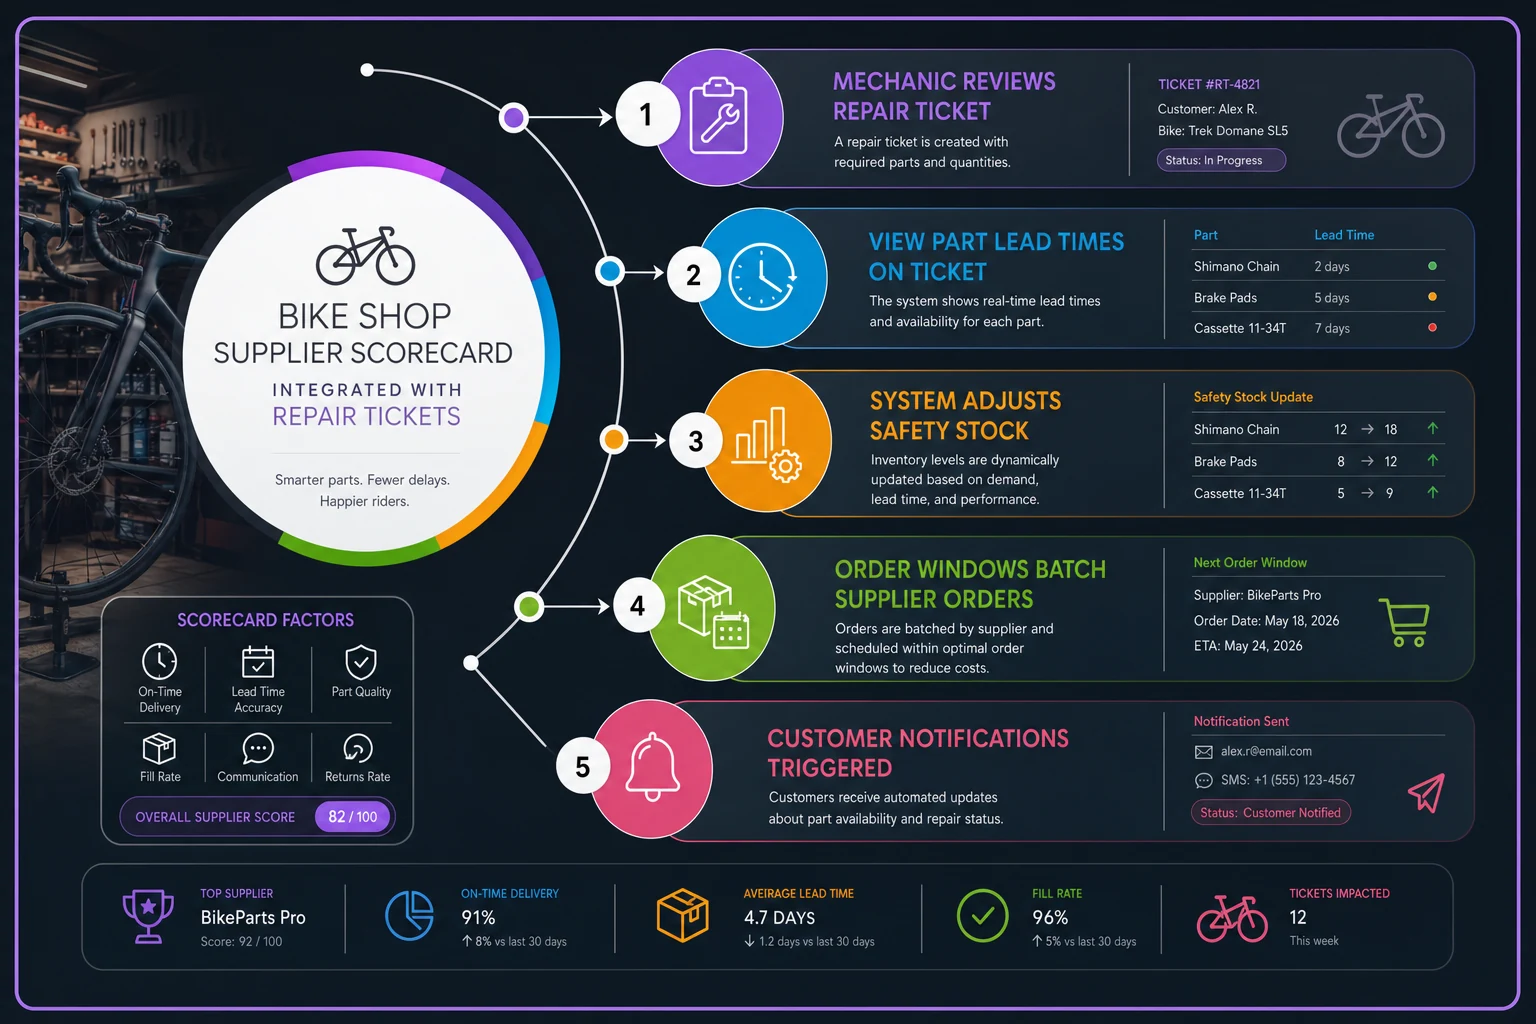
Scorecard data should also trigger automatic adjustments. When a supplier's lead time variance exceeds a threshold—say, ranging from 3 to 12 days instead of the usual 3 to 5—safety stock rules update accordingly. You're not manually reviewing reports and adjusting reorder points. The system responds to supplier performance changes in real time.
Consider how this plays out during a typical week. Monday morning, you're reviewing the week's scheduled repairs. Three jobs are flagged at risk due to supplier lead times. You can proactively call customers, offer alternatives, or expedite orders. By Wednesday, new tickets are scheduled based on realistic parts availability, not optimistic assumptions. Friday's parts orders account for each supplier's current performance, not their historical average.
Safety Stock Adjustments That Actually Work
Most safety stock formulas assume stable supplier performance. Real suppliers have good months and bad months. They run promotions that stretch lead times. They have warehouse transitions that create chaos. Your safety stock needs to respond to these changes, not ignore them.
Build adjustment triggers based on recent performance. If a supplier's lead time variance increases by 50% over a rolling 30-day period, automatically increase safety stock for their items by one increment. If they deliver late on three consecutive orders, flag all their SKUs for review.
But don't just increase buffers. Reduce them when suppliers improve. If QBP delivers on time for 20 consecutive orders, maybe you can trim safety stock and free up cash. The scorecard should work both ways—penalizing poor performance and rewarding consistency.
A shop that tracked BTI's tire deliveries saw this play out firsthand. Deliveries were running 4-5 days consistently. Then a warehouse transition pushed lead times to 8-14 days without any notice. Shops that caught the trend early increased tire safety stock and avoided stockouts. Shops relying on historical averages faced two weeks of delayed repairs and angry customers.
The adjustment mechanism doesn't need to be elaborate. Even a simple flag system works: Green = reduce safety stock 20%, Yellow = standard levels, Red = increase 50%. Review flags weekly, adjust monthly. This keeps inventory investment aligned with actual supplier risk.
When Supplier Scoring Reveals Bigger Problems
Sometimes the scorecard reveals issues beyond late deliveries. Patterns emerge that indicate fundamental supplier problems or misaligned business models.
A supplier might show excellent metrics for commodity parts but terrible performance on specialty items. They're optimized for volume, not variety. That's useful information when deciding whether to source high-end components elsewhere.
Quality patterns matter too, though they're harder to track. If 30% of warranty claims trace back to one supplier's components, that's not captured in lead time metrics but dramatically impacts operations. Every warranty claim means double handling, customer frustration, and reputation risk.
Payment terms affect operational cash flow more than most shops realize. Supplier A might have better prices, but if they demand payment on delivery while Supplier B offers net-30 terms, the real cost difference shifts. Your scorecard should factor in payment timing, not just product pricing.
Some suppliers penalize small orders through shipping structures that make frequent purchases uneconomical. Others incentivize consistent ordering with flat-rate shipping or free freight thresholds that actually work for shop-sized orders. These structural differences matter more than a 5% price variation.
Building Your Own Shop-Specific Scorecard System
Getting started doesn't require complex software or extensive historical data. Start with your highest-volume suppliers and most commonly-needed parts. Track for 30 days, then expand.
Week 1-2: Basic tracking
-
Note order date, promised delivery, actual delivery
-
Track by category, not just supplier overall
-
Flag any substitutions or stockouts
Week 3-4: Identify patterns
-
Calculate average and maximum lead times
-
Count ticket delays caused by each supplier
-
Note which suppliers communicated proactively about delays
Month 2: Implement initial rules
-
Set primary/secondary suppliers by category
-
Establish safety stock multipliers based on lead time variance
-
Create price threshold guidelines
Month 3: Refine and automate
-
Build simple tracking spreadsheets or adapt your POS system
-
Train staff on multi-source decision rules
-
Adjust safety stock based on accumulated data
The evolution from manual tracking to systematic scoring takes about 90 days. But even basic tracking immediately improves decision-making. You stop ordering from suppliers based on relationship or habit and start making data-driven choices that keep repairs moving.
Where Operational Software Makes the Difference
Manual supplier tracking works, but it decays. Someone forgets to update the spreadsheet. Tracking gets inconsistent. Old data starts polluting decisions. This is where AI-powered operational software earns its place—not by replacing your judgment, but by making the system sustainable.
Instead of manually tracking supplier performance across dozens of vendors and hundreds of SKUs, the platform continuously updates scorecards based on actual performance. It watches for variance patterns, flags concerning trends, and adjusts safety stock recommendations automatically.
The real value comes from integration. When supplier performance data connects directly to repair scheduling, parts ordering, and inventory management, the entire operation becomes more responsive. A supplier delay doesn't just update a scorecard—it triggers customer notifications, suggests alternative parts, and adjusts future order quantities.
Some platforms can even identify when a supplier's performance starts degrading weeks before it becomes critical, giving you time to pivot sourcing or increase safety stock proactively rather than reacting to a crisis mid-week.
The automation extends to actual ordering decisions too. When building a parts order, the system compares options across suppliers, factors in current lead times, applies price thresholds, and surfaces the best sourcing path. What traditionally takes 20 minutes of manual checking becomes a quick review of recommendations.
Making It Work in Your Shop
The perfect supplier scorecard doesn't exist. What works for a high-volume repair shop differs from what a boutique custom builder needs. But the principles stay consistent: track what impacts operations, adjust based on performance, and build systems that don't require constant maintenance.
Start small. Pick three suppliers and five high-volume SKUs. Track for two weeks. You'll immediately see patterns that change how you order. That derailleur hanger problem from the opening? With solid scorecard data, you'd already know to order from the faster supplier for urgent repairs while keeping regular stock flowing through the cheaper, slower channel.
The goal isn't to optimize every purchase. It's to prevent the cascading failures that happen when supplier problems hit unexpectedly—knowing which suppliers to trust with time-sensitive orders and which ones need extra buffer. Having clear rules so your team makes consistent decisions even when you're not around.
The shops that implement even basic supplier scoring consistently see improvements. Fewer stockouts, less panic ordering, better customer communication, improved cash flow. Not because they found perfect suppliers, but because they finally have visibility into supplier patterns that were always there, just hidden in the daily chaos of keeping repairs moving and customers happy.
Ready to revolutionize your bike shop operations?
Join hundreds of bike shops using Bicyclly to save time, increase revenue, and deliver exceptional customer service.