
Your shop floor isn't a warehouse. Every square foot either generates margin or wastes it. The difference between a bike shop netting 8% and one scraping by at 2% often comes down to how well they're managing 600 to 1,200 square feet of retail space.
Most bike shop planograms fail because they treat the shop like a miniature department store. Small bike shops operate more like high-touch specialty retailers with a service operation bolted on. The merchandising logic that works for Trek concept stores or big cycling warehouses breaks down completely when you're working with three wall bays, a center fixture, and maybe 400 square feet of actual selling floor after accounting for the service counter and bike storage.
The standard approach—organize by category, face everything forward, rotate seasonal stock—leaves money on the table. What works better is margin-weighted space allocation, rapid visual resets based on weekend traffic, and promotion cycles that match how your customers actually buy, not the industry calendar.
Why standard bike shop merchandising breaks at this scale
Standard merchandising assumes unlimited vertical space and browsing patterns that don't really exist in compact shops. A customer walking into a 900 square foot shop has maybe eight seconds before they've visually processed your entire retail floor. There's no discovery journey, no wandering through departments. They either see something that pulls them in, or they default to asking staff for help.
This creates a real problem. You need high-margin items visible and accessible, but you also need enough bikes on the floor to look like a legitimate bike shop. You need parts and accessories organized for easy shopping, but your mechanics need quick access to commonly used items. You need to showcase new products, but your bread-and-butter sellers are what pay the rent.
The math gets tight fast. A typical 800 square foot shop might have:
-
250 sq ft for bike display (8–12 floor bikes)
-
350 sq ft for retail fixtures
-
200 sq ft for counter, POS, and circulation
That 350 square feet of fixture space needs to generate roughly $400 per square foot annually just to hit industry benchmarks. But helmets might turn 3x per year at 45% margin while tubes turn 24x at 65% margin. Same shelf space, completely different contribution to your bottom line.
The standard approach—organize by category, face everything forward, rotate seasonal stock—leaves money on the table. What works better is margin-weighted space allocation, rapid visual resets based on weekend traffic, and promotion cycles that match how your customers actually buy, not the industry calendar.
The margin-per-inch calculation nobody teaches
Here's the framework that actually works for space allocation in small shops. Calculate margin dollars per linear inch of shelf space, factoring in both turn rate and gross margin percentage.
Never miss a sale or service appointment again.
Bicyclly helps you manage every sale, repair, and booking with ease and accuracy.
- Unified inventory and sales tracking
- Automated customer notifications
- Service appointment scheduling
No credit card required
Take inner tubes. A 4-inch wide hook holds 8 tubes. If you sell 16 tubes monthly at $8 with 65% margin, that's:
-
Monthly margin
16 × $8 × 0.65 = $83.20
-
Margin per inch
$83.20 ÷ 4 = $20.80 per linear inch
Compare that to a helmet taking up 12 inches of shelf space. Even at $120 with 50% margin, if it only sells once a month:
-
Monthly margin
1 × $120 × 0.50 = $60
-
Margin per inch
$60 ÷ 12 = $5 per linear inch
Tubes generate 4x more margin per inch despite lower individual ticket prices. This is why successful small shops dedicate prime real estate to high-turn consumables rather than impressive-looking but slow-moving accessories.
Setting up your 900 square foot planogram
Below is how an actual planogram might look for a 900 square foot shop running around $380k in annual retail sales (not including service), with these constraints:
-
30 feet of wall space
-
One 8-foot center gondola
-
10-bike floor display
-
15-foot service counter
Zone 1: Entry Impact (100 sq ft)
-
Featured bike on platform (changes weekly)
-
New arrival accessories on entry table
-
Current promotion signage
-
Seasonal must-haves within arm's reach
Zone 2: High-Turn Wall (120 linear feet)
-
40% to consumables (tubes, patches, chains, cables)
-
30% to high-margin accessories (lights, locks, computers)
-
20% to apparel (gloves, socks, base layers)
-
10% to seasonal flex space
Mount everything between 36 and 66 inches high. Below 36 inches gets ignored. Above 66 inches requires staff assistance, and in a small shop you don't have the bandwidth for constant ladder work.
Zone 3: Center Gondola (16 linear feet, both sides)
Side A (facing entry):
-
Top shelf
High-margin tools ($30–80 items)
-
Middle
Nutrition and hydration
-
Lower
Cleaning supplies and lubes
Side B (facing counter):
-
Top shelf
Electronics and mounts
-
Middle
Seasonal high-turn items
-
Lower
Bulk consumables for quick restock
Zone 4: Bike Display (250 sq ft)
-
4 bikes on wall hooks at eye level
-
4 bikes on floor stands in traffic flow
-
2 bikes elevated on platforms as features
Rotate positions weekly, not monthly. A bike in the same spot for 30 days becomes invisible. Move featured bikes every Monday morning, reposition floor bikes every Thursday for the weekend rush.
The weekend promotion calendar that actually drives sales
Forget monthly promotions. In a small shop, a month is too long for customers to notice and too short to clear seasonal inventory effectively. Weekend micro-promotions create urgency without training customers to wait for sales.
Week 1: Service add-on special
-
Thursday–Sunday only
-
20% off one accessory with any service
-
Push items with 55%+ margin
-
Average uptake
around 35% of service tickets
Week 2: Category spotlight
-
Friday–Saturday only
-
Buy 2 get 20% off in a single category
-
Rotate between lights/locks/nutrition
-
Drives multiple-item purchases
Week 3: New arrival preview
-
Soft launch new products
-
No discount, but first access
-
Creates urgency around next shipment
-
Builds a weekend destination habit
Week 4: Clear and reset
-
Sunday-only flash clear
-
30–40% off items being cycled out of the planogram
-
Makes room for next month's mix
-
Customers start to associate Sunday with surprises
This rotation means you're never more than 7 days from a promotion, but you're never training customers that everything eventually goes on sale. Keep each promotion under 4 days—long enough for word to spread, short enough to feel urgent.
Running one-week A/B tests without confusing customers
Small shops can't afford three-month merchandising experiments. By the time you know something isn't working, you've lost a quarter's worth of margin. Rapid one-week tests give clear enough signals without disrupting shopping patterns.
Testable elements:
Location tests (Week A vs Week B):
-
Move a category between eye level and waist level
-
Swap positions of two similar categories
-
Measure units sold, not just revenue
Pricing architecture tests:
-
Week A
Three price points ($15/$25/$45)
-
Week B
Four price points ($12/$22/$35/$55)
-
Track which structure drives higher basket size
Bundle configuration tests:
-
Week A
Pre-made bundles with 15% discount
-
Week B
Build-your-own with graduated discounts
-
Measure both uptake and average transaction
Visual density tests:
-
Week A
Full product facing, packed display
-
Week B
Reduced SKUs, more breathing room
-
Compare conversion rate for that zone
One rule: only test one element at a time and only in one zone. Testing multiple variables simultaneously makes it impossible to isolate what's actually driving changes.
Document results simply:
| Field | What to Record |
|---|---|
| Test week dates | Start and end date |
| Specific change made | One sentence description |
| Units sold | Previous week vs test week |
| Margin dollars | Dollar amount, not percentage |
| Decision | Keep or kill |
One rule: only test one element at a time and only in one zone. Testing multiple variables simultaneously makes it impossible to isolate what's actually driving changes.
The visual reset system that takes 90 minutes
Every Sunday night after close, you need about 90 minutes to reset your visual merchandising for the week ahead. This isn't deep cleaning or major reorganization—it's surgical adjustments that keep the shop feeling fresh without disorienting regular customers.
Minutes 0–20: Remove and assess
-
Pull anything that sold zero units in two weeks
-
Remove damaged or faded packaging
-
Clear expired promotions and signage
-
Box items for clearance
Minutes 20–45: Reposition features
-
Move featured bike to a new position
-
Rotate platform displays
-
Shift one high-margin category to a better spot
-
Update entry table with actual new arrivals
Minutes 45–70: Refresh displays
-
Face all products forward
-
Consolidate partial pegs onto full ones
-
Adjust shelf heights where needed
-
Replace worn price tags
Minutes 70–90: Stage promotions
-
Set up the upcoming weekend promotion
-
Place signage for Thursday launch
-
Pre-position inventory for easy access
-
Leave brief notes for morning staff
It doesn't need to be perfect. After 52 weekly resets, your merchandising will be dramatically tighter than shops doing quarterly planogram overhauls.
Converting dead zones into margin generators
Every small shop has them—awkward corners, narrow gaps, transition spaces that seem impossible to merchandise. Most shops either leave them empty or stuff them with clearance. Both approaches waste square footage.
The two-foot gap between wall fixtures and a corner works well for vertical tube and patch displays that customers can browse while waiting at the counter. Mount slat wall and use waterfall hooks. That previously dead space can generate a couple hundred dollars a month without much effort.
The space under bike work stands is good for pull-out bins of seasonal soft goods like toe covers and arm warmers. Customers browsing bikes naturally look down, and those items become easy impulse adds to bike purchases.
The area behind your door when it's open? Most shops lose that completely. A narrow vertical rack for single SKUs—CO2 cartridges, single-serve nutrition, valve caps—works well there. Items under $10 that customers can grab while literally walking out the door.
Ceiling space above 8 feet isn't ideal for regular merchandise, but it works for boxed inventory of your fastest-turning items. A simple pulley system lets staff quickly lower boxes of tubes, chains, or cables without ladder gymnastics every time.
Why traditional planograms fail with service-retail hybrid operations
Bike shops aren't pure retail. When 40–60% of your revenue comes from service, your merchandising needs to support both retail browsers and service customers simultaneously. Traditional planograms assume customers are there primarily to shop. In a bike shop, a lot of people are killing time while waiting for repairs or picking up completed work.
Service customers are captive audiences with immediate needs. They're not comparison shopping on their phones while standing in your shop—they're looking for solutions to problems they're actively dealing with.
Position high-margin consumables and tools within sight lines of your service counter. Someone picking up a tune-up can see chains, cassettes, and brake pads—items they might actually need soon based on what the mechanic just told them. This natural adjacency drives attachment rates without feeling pushy.
A simple "while you wait" zone with nutrition, small accessories, and maybe a magazine rack also helps. Someone waiting 20 minutes for a flat repair will spend $12 on energy bars and a water bottle just to pass the time. Small dollars, but it adds up across hundreds of service tickets a year.
Tracking what actually matters
Most POS systems want to track everything—average transaction value, units per transaction, category velocity, conversion rates. For a small shop with limited bandwidth, that creates analysis paralysis. Track three metrics that actually drive decisions:
Margin dollars per square foot per month Not percentage—dollars. A 4-square-foot section generating $300 monthly at 40% margin beats an 8-square-foot section generating $400 at 25% margin. That's $120 versus $100 in actual profit.
Weekend vs weekday velocity by zone Where customers shop changes dramatically between Tuesday afternoon and Saturday morning. Your tube display might sit untouched on weekdays but get cleaned out every weekend. Track zone performance separately so you're optimizing for when you actually make money.
Promotion attachment rate Not just promotion sales, but what else customers buy during promotional periods. If your weekend tool special drives $500 in tool sales but adds $800 in additional purchases, the promotion is working even if the featured items are low margin.
Track these weekly, not monthly. Monthly averages hide patterns. A helmet display might look fine on a monthly report, but if all the sales happen in one weekend, you're wasting prime real estate 25 days out of the month.
Integration with existing operations
Your merchandising system needs to connect with your inventory forecasting and pricing strategies. The best planogram in the world falls apart if you're constantly out of stock on displayed items or if your visual merchandising contradicts your pricing structure.
Build feedback loops between service and retail. When mechanics notice patterns—everyone needs brake pads this month, tube patches are moving fast—adjust your merchandising to capitalize before customers have to ask. Move those items to prime positions early.
Align your merchandising calendar with service scheduling too. If you're booked solid on tune-ups next week, feature cleaning supplies and small upgrades this week. Customers picking up serviced bikes are already primed to buy maintenance items.
Make merchandising changes part of your operational rhythm. Monday morning: rotate bikes. Thursday afternoon: set weekend promotions. Sunday night: visual reset. When merchandising becomes part of the workflow instead of an interruption, it actually happens consistently.
> WORKFLOW: Weekly Merchandising Rhythm > Monday → Rotate featured bikes and update entry table > Thursday → Set weekend promotion and stage signage > Sunday → Full 90-minute visual reset and zone review
This diagram shows the weekly cadence and who does what in each step.
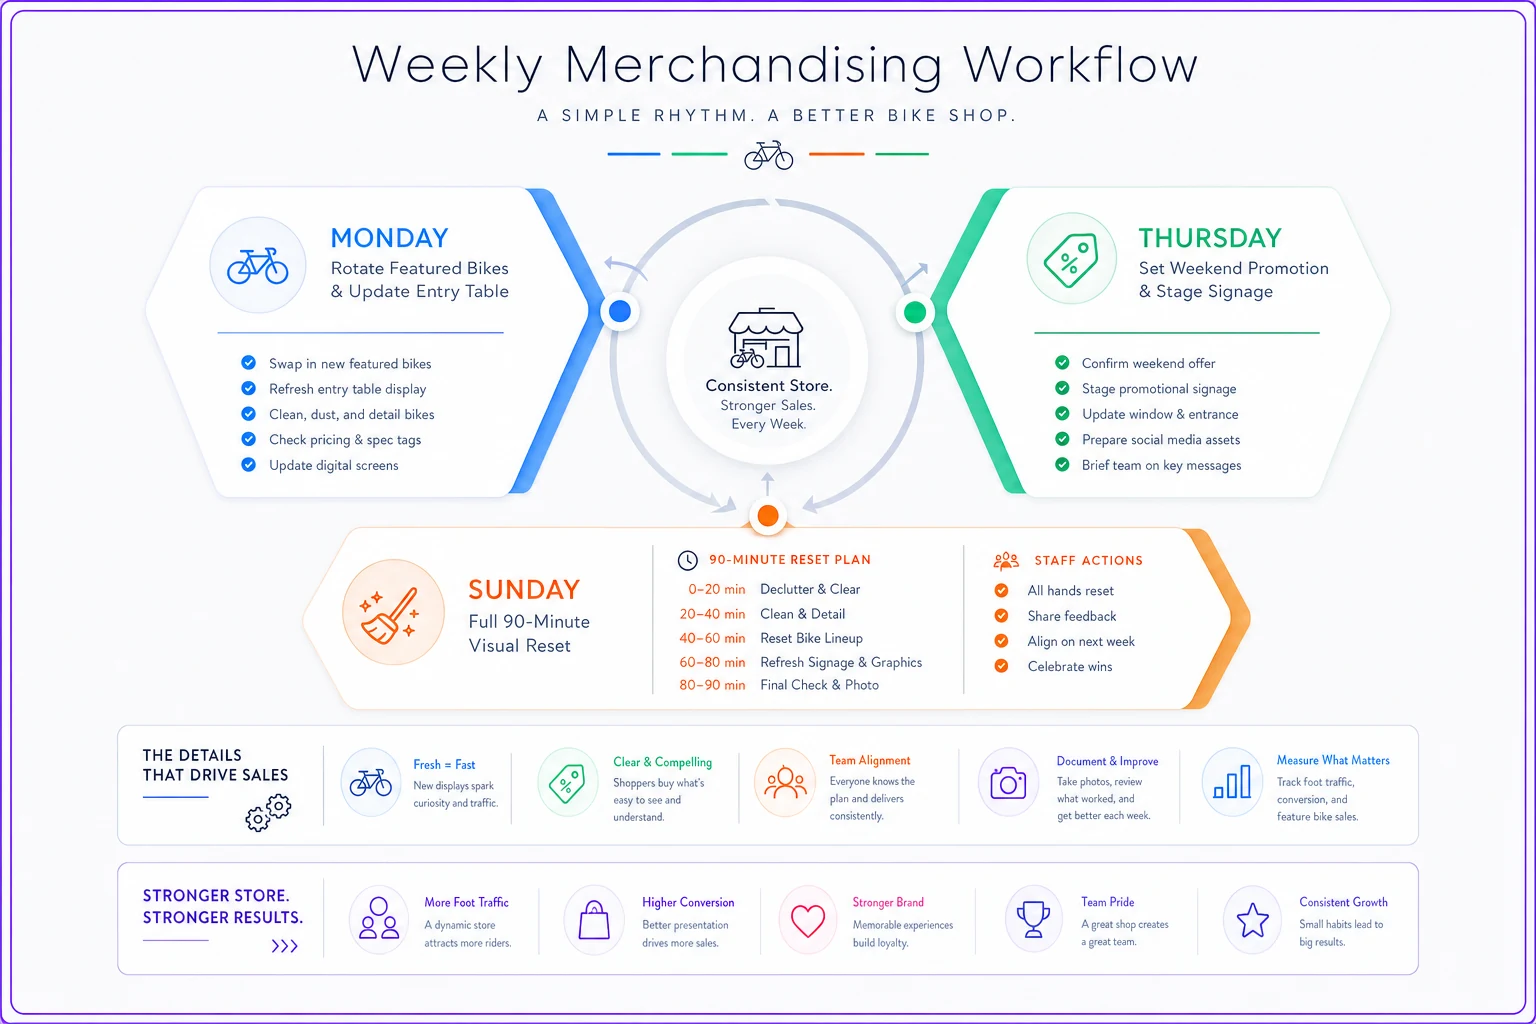
Make merchandising changes part of your operational rhythm. Monday morning: rotate bikes. Thursday afternoon: set weekend promotions. Sunday night: visual reset. When merchandising becomes part of the workflow instead of an interruption, it actually happens consistently.
When the system starts breaking
As sales grow, the rigid structure starts working against itself. The margin-per-inch calculation that worked at $300k annual revenue might concentrate too much space in low-price-point items at $500k. Customers ready to spend more can't find premium options because you've optimized everything for velocity.
The weekend promotion cycle that initially drove traffic can eventually train customers to only shop during promotions. You'll see it clearly—Wednesday sales drop to almost nothing while Sunday gets overwhelming. The fix isn't abandoning promotions but varying the pattern so it's less predictable.
Space allocation formulas also assume a stable product mix, and bike shops face constant disruption. A new direct-to-consumer brand can make your helmet wall feel outdated overnight. Supply chain issues mean you can't get tubes for months. Rigid planograms can't adapt fast enough.
This is where operational software becomes genuinely useful. When you're tracking margin contribution weekly instead of monthly, you catch problems before they compound. When your inventory system connects to your merchandising plan, you stop dedicating prime space to items you can't restock. When promotion performance feeds back into buying decisions, you stop repeating the same expensive mistakes.
Beyond the planogram
A bike shop merchandising planogram is really about matching space to margin opportunity in real time. It's not a static document you update quarterly—it's a system that responds to actual sales patterns, service trends, and customer behavior.
The shops consistently hitting 10%+ net margins aren't following industry-standard merchandising guides. They're running their floor space like a testing environment, constantly adjusting placement, pricing, and promotion to squeeze maximum margin from minimum square footage. They understand that in a small retail space, every fixture position is a business decision.
Merchandising isn't separate from operations. It's the visible expression of your entire business system. Your planogram tells customers who you are, what you value, and how you can help them. Make sure it's telling the right story.
Ready to revolutionize your bike shop operations?
Join hundreds of bike shops using Bicyclly to save time, increase revenue, and deliver exceptional customer service.