



Most shops don't have a data problem. They have a decision problem. The numbers are right there — service margin, bay utilization, aging inventory, trade-in turns — but the gap between "I can see the number" and "I know what to do about it" is where money quietly leaks out.
A shop can run a beautiful dashboard for a year and still make the same wrong call every week: refurbishing a frame that should've been parted out, holding a used bike that should've been listed two months ago, staffing Saturdays like it's still peak season. The dashboard isn't wrong. The wiring between metric and action was never built.
This is a playbook for that wiring. Not another list of KPIs to track — you already know your KPIs. This is about the mapping: which number triggers which decision, at what threshold, and how those thresholds change depending on the size of your shop. Think of it as a bike shop KPI decision playbook you can actually run without a finance background.
The problem with most KPI setups: they measure, they don't decide
Here's the pattern that shows up in a lot of shops. Someone — usually the owner, sometimes a sharp service manager — builds a solid reporting habit. They know last month's revenue split between retail and service. They know their attach rate. They can quote gross margin off the top of their head.
But ask them a specific question — "This 2-year-old trade-in gravel bike came in at $600 valuation, needs a drivetrain and a fork service, what do you do with it?" — and the answer becomes a gut call. Sometimes it's a good gut. Often it's the same instinct that's been overvaluing reconditioning labor for years.
The metric exists. The decision rule doesn't.
What separates a shop that grows cleanly from one that grinds is not more data. It's a small set of pre-agreed decision rules that turn a metric crossing a line into a specific action. When margin on a service category drops below X, you do Y. When a used bike ages past Z days, it gets relisted or wholesaled. No meeting. No debate. The rule already decided.
That's the whole game. Everything below is how to build it.
Start with a one-page KPI hierarchy (not a 40-metric dashboard)
The reason most dashboards don't drive decisions is that they're flat. Forty metrics sitting next to each other, all the same visual weight, none of them clearly causing the ones below. When everything looks equally important, nothing gets acted on.
Never miss a sale or service appointment again.
Bicyclly helps you manage every sale, repair, and booking with ease and accuracy.
- Unified inventory and sales tracking
- Automated customer notifications
- Service appointment scheduling
No credit card required
A KPI hierarchy fixes that by forcing a tree structure. At the top sits the one number that actually matters for survival. Underneath it sit the two or three drivers that move it. Underneath those sit the operational levers you can pull today.
Here's the shape most single-location shops should use:
Tier 1 — Outcome (1 metric): Monthly contribution margin (revenue minus variable costs — parts, labor at cost, direct card fees). Not top-line revenue. Revenue hides a lot of sins.
-
Service gross margin %
-
Retail/used inventory turns
-
Bay utilization (billable hours ÷ available tech hours)
-
Attach rate on service tickets
Tier 3 — Operational levers (the stuff you touch daily):
-
Average ticket turnaround time
-
Aging buckets on used bikes and low-turn parts
-
Reorder timing on consumables
-
No-show / reschedule rate
-
Quote-to-approval conversion
The point of the hierarchy isn't to be exhaustive. It's to make cause and effect visible. When contribution margin dips, you don't stare at 40 boxes — you walk down the tree. Which Tier 2 driver moved? Which Tier 3 lever explains it? That walk takes maybe four minutes once the tree is built, and it replaces the hour-long "why was last month soft" conversation that never actually reaches a conclusion.
Worth stating plainly: shops that keep this tree to a single printed page tend to make better decisions than shops with a slick BI tool. The constraint forces prioritization. If it doesn't fit on one page, you haven't decided what matters yet.
If your books don't cleanly separate variable from fixed costs, the whole tree wobbles. Getting your ticket data and accounting to agree is the prerequisite — this is exactly the plumbing covered in Turn Tickets into Clean Books. Build that first, then build the tree on top of it.
The core idea: decision trees for the choices you keep re-litigating
Certain decisions come up over and over in a bike shop, and each time they get treated like a fresh problem. They shouldn't be. These are pattern decisions, and pattern decisions deserve trees.
The two most expensive ones for most shops:
-
Part-out vs. refurbish — for a used bike or a trade-in
-
List vs. hold — for finished used inventory sitting on the floor
Both are worth building out properly, because the logic transfers to almost any repeated operational choice.
Decision tree: part-out vs. refurbish
-
Estimate the realistic resale price — not hoped-for, realistic, based on what comparable used bikes actually sell for in your area and channel.
-
Estimate total recondition cost — parts at cost plus labor at your loaded shop rate (not zero, even if it's your own bench filling a slow hour).
-
Compute projected margin resale price − recondition cost − acquisition/trade value.
-
Apply the threshold if projected margin ÷ resale price is below your floor (more on floors below), don't refurbish.
-
If below floor → estimate part-out yield sum the resale value of harvestable components (drivetrain, wheels, fork, dropper, cockpit) minus teardown labor.
-
Choose the higher net of (refurbish margin) vs. (part-out yield). If both are weak, wholesale the whole thing and move on.
The step people skip is #2 — costing their own labor. A tech spending three hours reconditioning during a slow Tuesday still consumed three billable hours of bay capacity. Pretending that's free is how a shop convinces itself a break-even refurbish was profitable.
Decision tree: list vs. hold
-
Check age in inventory against its aging bucket.
-
If under the "fresh" threshold → hold and list at full target price.
-
If in the middle bucket → keep listing but trigger a repricing review (drop 8–12%, refresh photos, boost placement).
-
If past the "stale" threshold → force a decision
markdown to move, transfer to a higher-demand channel, or wholesale.
-
Never let a used bike sit past the stale threshold "just in case." The carrying cost — cash tied up, depreciation, space — almost always exceeds the extra $75 you might squeeze out by waiting.
The insight most shops miss: holding feels free because there's no invoice for it. But every used bike aging past its bucket is silently charging you rent. Making that rent visible in the hierarchy — the aging bucket sits right there in Tier 3 — is what turns "let's give it another few weeks" into an actual dated decision.
Sample thresholds by shop size
Thresholds aren't universal. A 700 sq ft single-mechanic shop and a three-bay operation with a floor manager have completely different tolerances for tied-up cash and slow turns. Applying the same numbers to both is a common and expensive mistake.
These are starting-point ranges — calibrate against your own history, don't adopt them blindly:
| Metric / Threshold | Small shop (1–2 staff, ~$300–600k rev) | Mid shop (3–6 staff, ~$600k–1.2M) | Larger shop (7+ staff, $1.2M+) |
|---|---|---|---|
| Refurbish margin floor (margin ÷ resale) | 30–35% | 25–30% | 22–28% |
| Used bike "fresh" bucket | 0–21 days | 0–30 days | 0–45 days |
| Used bike "stale" trigger | 45 days | 60 days | 75–90 days |
| Bay utilization target | 65–72% | 70–78% | 75–82% |
| Service gross margin floor | 62% | 60% | 58% |
| Low-turn part reorder trigger | 2+ tickets/quarter | 3+ tickets/quarter | 4+ tickets/quarter |
| Attach rate action threshold | below 0.7 | below 0.9 | below 1.1 |
Smaller shops need higher refurbish floors, not lower. Counterintuitive, but true — a small shop has less capacity to absorb a mistake and less volume to average it out. One bad refurbish that ties up $700 for two months hurts a $400k shop far more than a $1.5M one. Discipline is the small shop's substitute for scale.
Stale triggers get looser as you grow, not tighter. A bigger shop has more channels to move stock through and more floor space to absorb aging, so it can afford to wait a little longer for the right buyer. A small shop can't — cash velocity matters more than squeezing the last few dollars of margin.
Low-turn reorder logic scales with volume. The trigger that makes sense — reorder after N tickets in a window — depends on how many tickets you're actually seeing. Building that trigger off real repair-ticket demand rather than gut feel is the whole point of a ticket-driven reorder method, and it's what keeps a small shop from stocking $2,000 of parts it'll use twice a year.
Worked example: tying the metric to the action
The shop: mid-sized, four staff, roughly $850k annual, decent used-bike program.
The trigger: the monthly walk-down shows contribution margin off about $2,400 from the trailing three-month average. Not a disaster, but enough to walk the tree.
Tier 2 check: service margin is holding fine at 61%. Turns are steady. But bay utilization dropped to 66% against a 74% target, and attach rate slipped to 0.8. Two drivers moved.
Tier 3 walk: on the utilization side, average turnaround crept from about 3 days to nearly 5 — tickets are sitting because a mid-tier tech left and dispatch got sloppy. On the attach side, the POS prompt sequence quietly stopped firing after a software update, so nobody was offering bar tape, sealant, or brake pad add-ons at checkout.
The decisions the rules produced:
-
Turnaround past its SLA bucket → trigger overflow policy
cap intake for one week, pull one mechanic off used-bike reconditioning back onto customer tickets. This is also the moment to re-run the part-out vs. refurbish tree on the recon queue — with capacity tight, the refurbish floor should effectively tighten.
-
Attach below 0.9 threshold → fix the prompt, spot-check three checkouts a day for two weeks.
Roughly six weeks later, turnaround was back near 3 days, utilization climbed back into the low 70s, and attach recovered to around 1.0. Contribution margin recovered most of the gap. No heroics — the rules just pointed at two levers and everyone knew the action without a meeting.
Nobody "found" a problem through inspiration. The hierarchy surfaced which drivers moved, and the decision rules said what to do. That's the difference between a dashboard and a playbook.
When this system actually makes sense — and when it doesn't
It makes sense when:
-
You're running both retail and service and the interactions between them are getting hard to hold in your head.
-
You keep re-debating the same decisions (refurbish, list/hold, reorder) with inconsistent outcomes.
-
You have at least a few months of clean ticket and inventory data to calibrate thresholds against.
It's a bad idea when:
-
Your underlying data doesn't reconcile. If your POS, inventory, and accounting disagree, every threshold you set is built on sand. Fix the reconciliation first — the data-mapping and reconciliation routines here are the prerequisite, not an optional extra.
-
You're pre-launch or seasonal-only with too little history to set meaningful floors. Track first, threshold later.
Who should NOT over-engineer this: a true one-person shop doing 10 tickets a week. At that scale the owner is the decision tree, and formalizing it adds overhead without payoff. The hierarchy earns its keep when there's more than one person making the same class of decision — that's when inconsistency starts costing real money.
Building it so it runs without you
A decision playbook that lives in your head isn't a playbook — it's a habit that dies when you're on vacation. The point of writing the thresholds down and wiring them to actions is that other people can execute them.
The practical build order:
-
Get the data clean. Reconcile POS, inventory, accounting. Non-negotiable first step.
-
Draw the one-page hierarchy. Tier 1 outcome, Tier 2 drivers, Tier 3 levers. Print it.
-
Set thresholds from your own history, using the table above as a rough starting frame.
-
Write the decision trees for your top 3–4 repeated choices. Part-out vs. refurbish and list vs. hold are the usual starters.
-
Assign each threshold an owner and a review cadence — weekly for fast-moving levers, monthly for the margin walk.
-
Run the monthly walk-down as a fixed routine, not an ad-hoc panic.
Where operational software earns its place in this setup is quiet and specific. It keeps the aging clock running on every used bike without someone remembering to check, flags when a service category crosses its margin floor before the month closes, and fires the reorder trigger off actual ticket demand instead of a hunch. The thresholds and trees are still yours — a decent workflow platform just watches the lines so a busy service manager doesn't have to, and surfaces the crossing before it becomes a $2,400 gap you're explaining after the fact.
Here's a simple workflow you can map to your shop.
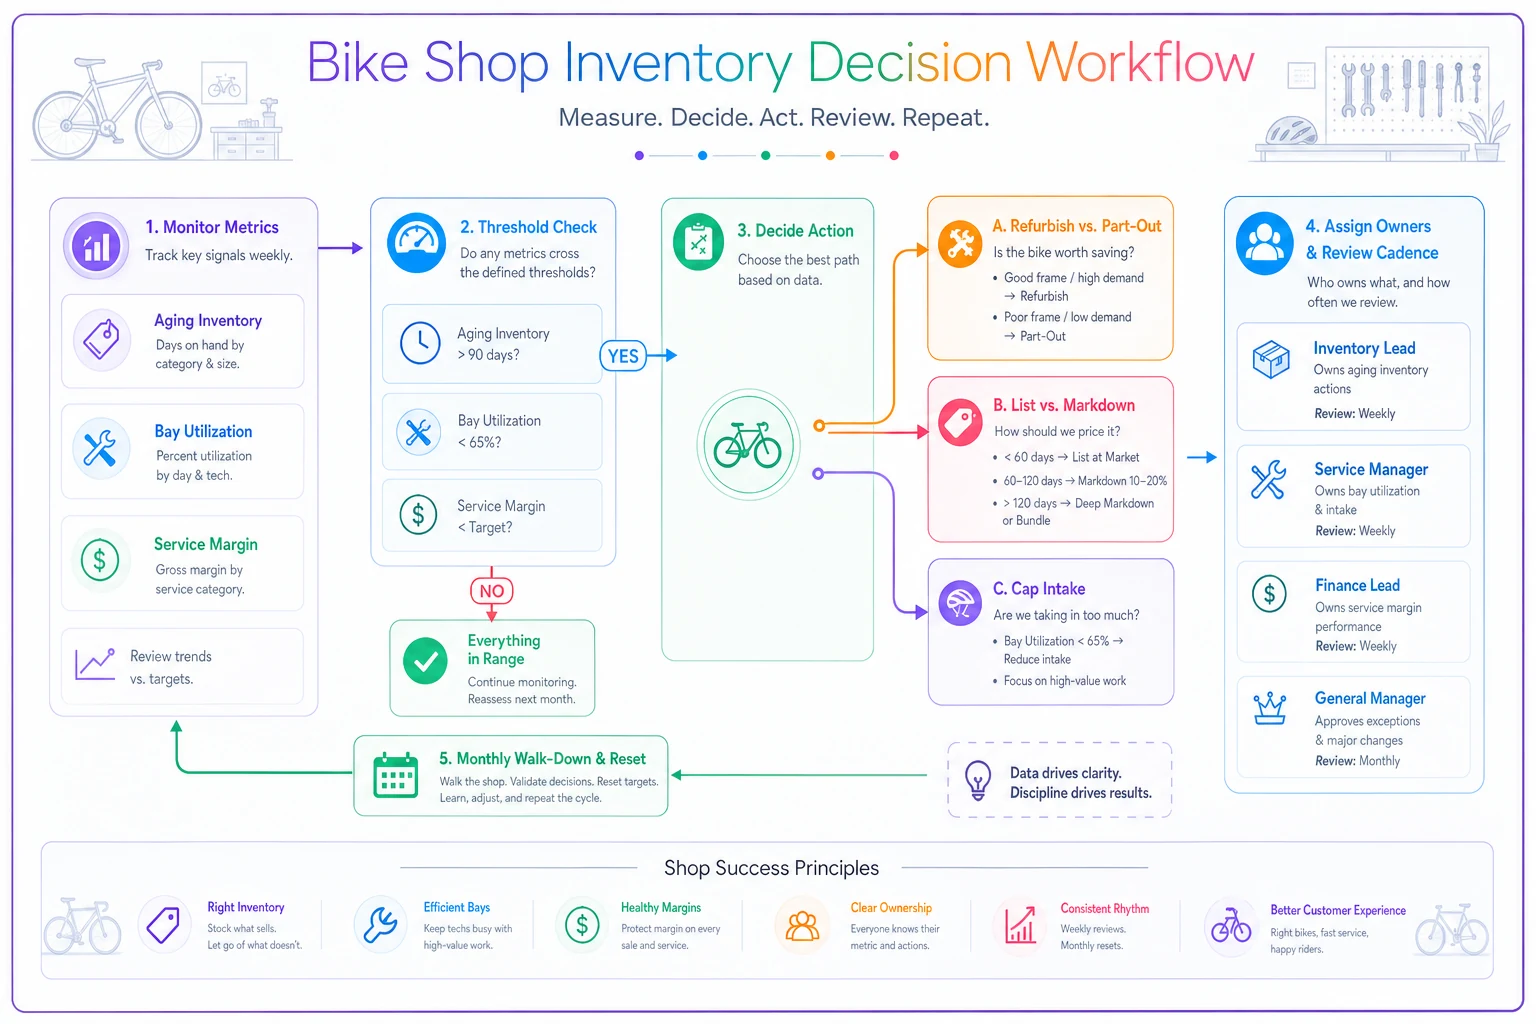
Map this to your one-page hierarchy and assign owners to each branch. The software just watches the lines; the rules do the deciding.
Build the tree. Set the floors. Write the rules. Then let the numbers tell you what to do instead of asking you to guess.
Ready to revolutionize your bike shop operations?
Join hundreds of bike shops using Bicyclly to save time, increase revenue, and deliver exceptional customer service.