

Most shops think about customer experience as a series of disconnected moments. Someone books a tune-up. Someone drops off a bike. Someone pays and leaves. Each moment gets handled by whoever's standing closest, and the quality depends entirely on how busy the shop is that day.
That works fine at 15 tickets a week. It stops working the second you cross into real volume, run two mechanics, or open a second location. What was "everyone just knows how we do things" turns into "nobody's sure who owns the handoff," and customers feel the gaps even when they can't name them.
A bike shop customer journey map isn't a marketing exercise. It's an operational document that shows where a customer physically and emotionally moves through your business, where responsibility changes hands, and where things quietly fall apart. Done right, it connects your service SLAs to your compensation rules, your recovery scripts to your review funnel, and your journey changes to actual KPI lifts. Done wrong, it's a poster on the wall nobody reads.
The five stages, and what actually breaks in each one
Every customer moves through roughly the same arc: discovery → booking → service → pickup → recovery. The trap is treating these as marketing funnel stages. They're not. Each one is a workflow with an owner, a set of inputs, and a specific way it fails.
Here's how the stages break down operationally, and where the failure points live:
| Stage | Who owns it | Common failure point | What the customer feels |
|---|---|---|---|
| Discovery | Front desk / online presence | Stale hours, no online booking, unanswered DMs | "Are they even open? Do they do my kind of bike?" |
| Booking | Service writer / booking system | Overbooked bays, no deposit, vague scope | "I don't know what I'm paying or when it'll be done" |
| Service | Lead mechanic | Parts delays, scope creep, no status update | "It's been 5 days and nobody called me" |
| Pickup | Front desk | Surprise charges, bike not ready, rushed handoff | "This isn't what I expected to pay" |
| Recovery | Owner / manager | No follow-up, complaints go to Google instead of you | "I'll just leave a 2-star and never come back" |
What most owners miss: the failure in one stage usually shows up as a complaint in a later stage. A vague booking scope (stage 2) becomes a surprise charge at pickup (stage 4), which becomes a bad review during recovery (stage 5). If you only fix the review problem, you're treating symptoms. The actual problem is upstream.
The discovery-to-booking transition and the service-to-pickup transition are where most revenue leaks out in service-heavy shops. Discovery-to-booking is where you lose people who were ready to buy. Service-to-pickup is where you burn the goodwill of people who already trusted you.
Why the handoffs are where shops actually lose money
Think about a single repair ticket. Realistically, it gets touched by three or four people — the person who books it, the mechanic who does the work, maybe a second mechanic who finishes it, and whoever checks the customer out. Every one of those transitions is a handoff, and every handoff is a place where information can drop.
Never miss a sale or service appointment again.
Bicyclly helps you manage every sale, repair, and booking with ease and accuracy.
- Unified inventory and sales tracking
- Automated customer notifications
- Service appointment scheduling
No credit card required
Here's a typical example of how it goes sideways:
A customer books a "tune-up" over the phone on Monday. The service writer notes "tune-up" and nothing else. Tuesday, the mechanic opens the bike and finds a worn cassette and a cracked rim. He fixes the cassette because it's cheap, sets the rim aside to ask about, and gets pulled onto three other bikes. Thursday, nobody's called the customer. Friday, the customer shows up expecting a $75 tune-up and gets handed a $210 bill with a "your rim is toast, by the way" delivered at the counter.
Nothing in that story is a skill problem. The mechanic did good work. The service writer wrote the ticket. It's a coordination problem — scope wasn't nailed down at booking, the status update never happened during service, and the bad-news conversation landed at the worst possible moment.
At low volume, you absorb this. The owner overhears it, apologizes, discounts $30, moves on. At 40-plus tickets a week across multiple mechanics, this happens several times a day and nobody's tracking it. The discounts add up. Reviews slip. And the owner has no idea which stage is actually bleeding, because it all just feels like "customers being difficult."
Tying SLAs to compensation so the promise has teeth
Most shops skip this part. You can set a turnaround SLA — say, "standard tune-ups done in 3 business days" — but an SLA without a consequence is just a hope. What makes it real is a linkage between the SLA breach and a defined compensation trigger.
If you promised something and missed it, the customer gets something automatic, before they have to ask. This protects the relationship and — more importantly — it creates a tracked event every time you fail. Now you have data.
A workable SLA-to-compensation ladder looks something like this:
-
1 day late Proactive call or text explaining the delay, no charge for the delay itself
-
2–3 days late Free minor add-on (bar tape, tube, basic adjustment) or 10% off the ticket
-
Parts delay beyond a week Loaner arrangement if possible, or a rebate on the labor portion
-
Repeated miss on the same customer Manager involvement, meaningful discount, and a flag in their profile
The key word is automatic. If compensation only happens when a customer complains loudly enough, you're rewarding the loud ones and quietly losing the polite ones — who just never come back.
Pro-tip: automate SLA triggers in your ticketing system so compensation events are logged and applied without manual steps.
The journey-map angle here is different from standard customer-service thinking: the compensation trigger is a measurement point on your journey map, not just a nicety. Every trigger that fires is telling you exactly where your service stage is breaking. The mechanics of turnaround SLAs and repeat-customer retention connect directly to this — there's more on that in the lifecycle system for bike shops.
One pattern worth noting: shops that formalize this almost always find the breaches cluster around specific job types. It's rarely random — it's the overhaul that always runs long, or the wheel builds that always wait on spokes.
Standardized recovery playbooks (so recovery isn't improv)
Recovery is the stage everyone handles by gut feel, which is exactly why it's inconsistent. One customer gets a heartfelt apology and a free tube. The next gets a shrug because it was a busy Saturday. The customer talks to their riding group, and your "recovery" reputation becomes a coin flip.
A recovery playbook standardizes the response, not the emotion. The point isn't to make it robotic — it's to make sure the floor is the same regardless of who's working and how slammed they are.
A basic recovery playbook has three tiers:
-
Minor friction (small delay, small billing confusion)
Front desk acknowledges it, fixes it on the spot, notes it in the ticket. No manager needed. Resolution target: same visit.
-
Real disappointment (blown SLA, quality redo, meaningful overcharge): Defined comp from the ladder, a follow-up message within 24 hours, and a note in the customer's profile so the next interaction acknowledges it.
-
Relationship at risk (angry customer, repeat failure, public complaint): Owner or manager owns it directly, personal contact, and a recovery offer that's genuinely generous — because keeping this customer is cheaper than replacing them.
The mistake shops make is jumping straight to Tier 3 generosity for Tier 1 problems, giving away margin unnecessarily. More commonly, they treat Tier 3 problems like Tier 1 with a shrug and a "sorry" for something that cost the customer a weekend ride. A written playbook keeps the response proportional.
A well-run recovery is also your single best source of five-star reviews. A customer whose problem got fixed well often becomes more loyal than one who never had a problem at all. The two-step feedback funnel for turning service visits into reviews is the natural extension of a good recovery — you route the recovered, happy customer toward a public review, and route the still-unhappy one toward a private conversation before they post.
The measurement plan — what to actually track at each stage
A journey map without measurement is decoration. You need one or two metrics per stage that tell you whether that stage is healthy. Not fifteen. One or two, tracked consistently, beats a dashboard nobody looks at.
Here's a lean measurement plan mapped to the five stages:
-
Discovery Booking conversion rate (inquiries → booked appointments). If people ask and don't book, your discovery-to-booking handoff is leaking.
-
Booking Scope-accuracy rate (tickets that finished at the quoted scope vs. tickets that grew). High scope creep means your booking conversations are too vague.
-
Service SLA-hit rate (tickets completed within promised turnaround) and the count of compensation triggers fired.
-
Pickup Surprise-charge rate (tickets where final price exceeded quote by more than a set threshold) and add-on attach rate at checkout.
-
Recovery Detractor recovery rate (unhappy customers who returned within 90 days) and review volume and rating trend.
The insight most owners resist: conversion, retention, and LTV don't move because of one heroic change. They move because you close small leaks at each stage. A 5% improvement in booking conversion, a 5% drop in scope surprises, and a 5% lift in SLA-hit rate compound into something you can actually see in the P&L. Chasing one big lever usually disappoints.
Where AI-powered operational software genuinely helps is in automatically capturing these events instead of relying on someone to log them manually. When your booking, service ticketing, and checkout all live in one platform, the SLA clock, the scope quote, and the final charge are already recorded — so your stage metrics build themselves instead of requiring a Friday spreadsheet session that never actually happens.
An experiment roadmap: tying journey changes to KPI lifts
A sane 90-day experiment roadmap looks like this:
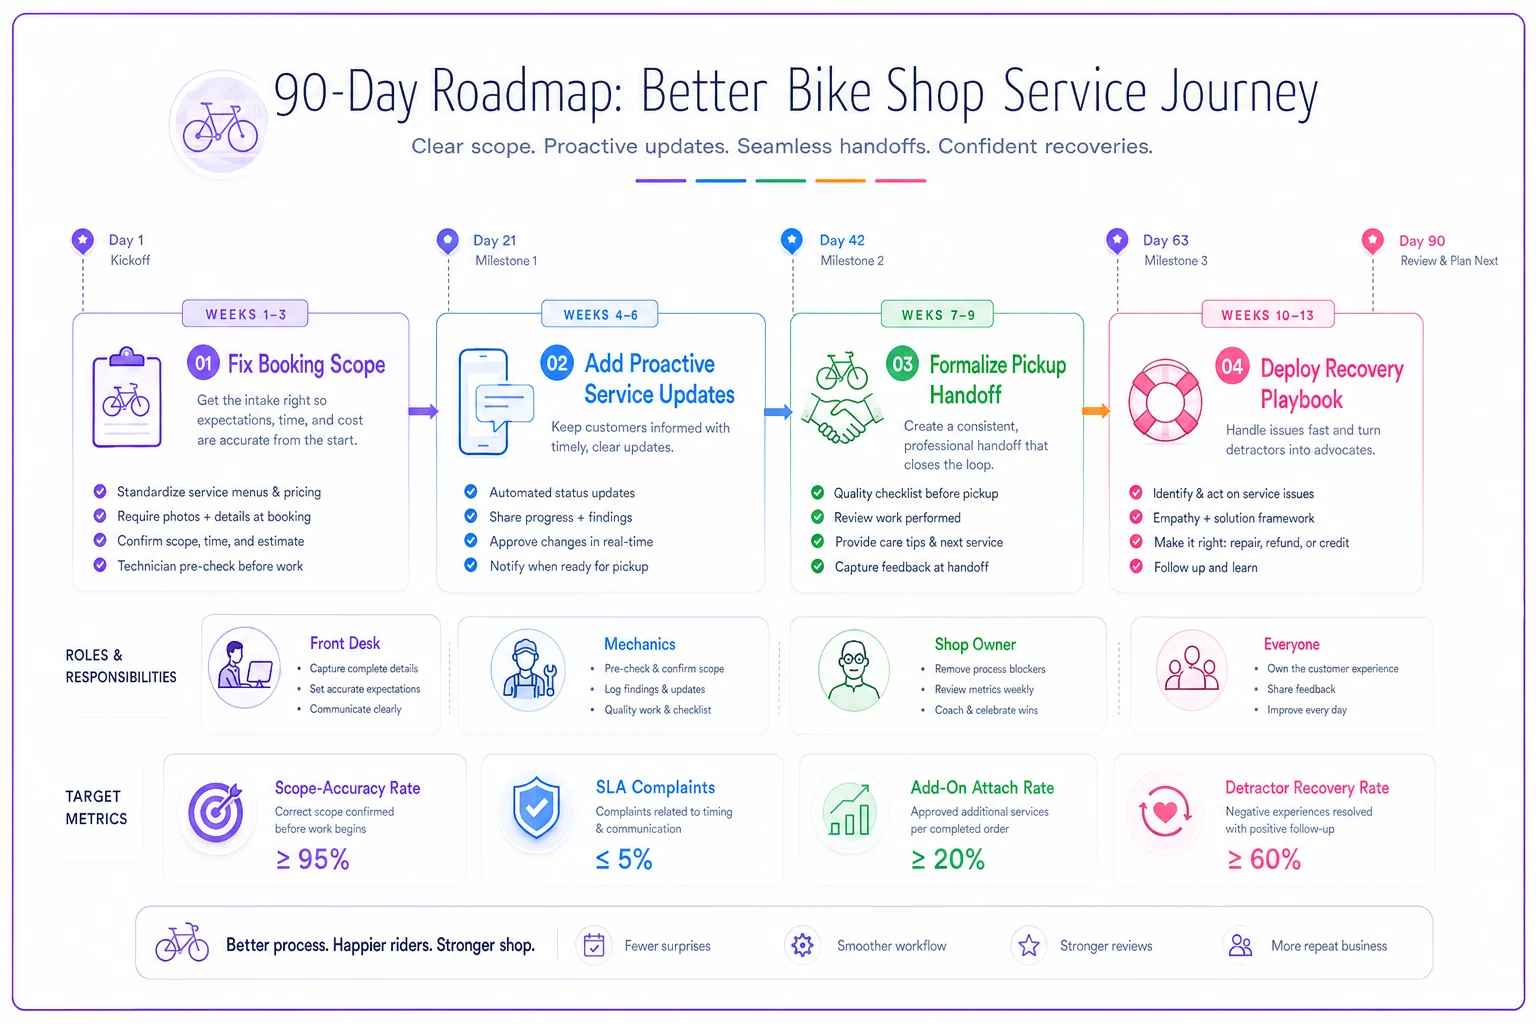
Simple timeline of the four experiments and their target metrics.
-
Weeks 1–3 — Fix the booking scope. Standardize the questions asked at booking so scope is nailed down before the bike arrives. Target metric: scope-accuracy rate and surprise-charge rate. Hypothesis: tighter scope up front reduces pickup surprises.
-
Weeks 4–6 — Add proactive service updates. Every ticket gets a status touchpoint at a defined trigger (bike opened, parts ordered, work complete). Target metric: SLA-related complaints and compensation triggers fired.
-
Weeks 7–9 — Formalize the pickup handoff. A short, consistent checkout script that reviews what was done, why, and what to watch for. Target metric: pickup add-on attach rate and post-visit satisfaction.
-
Weeks 10–13 — Turn on structured recovery and review routing. Deploy the recovery playbook and the feedback funnel together. Target metric: detractor recovery rate and review rating trend.
Run one experiment at a time so you can actually attribute the lift. If you change four things in one week and conversion improves, you've learned nothing about why. This is the same discipline behind running controlled promotions without wrecking your operations — the flash sale runbook approach uses the same logic of protecting your baseline while you test a change.
When this level of formality actually makes sense
Not every shop needs a documented journey map with SLA-linked compensation ladders. If you're a one-person operation doing 10–15 tickets a week and you personally touch every customer, you are the coordination layer. Formalizing it might slow you down more than it helps.
This makes sense when:
-
You've got two or more mechanics and handoffs happen between people
-
You're seeing repeat complaints that feel like "process," not "people"
-
You can't tell which stage is costing you money
-
You're planning to add staff or a second location and need the experience to survive without you standing there
This is probably premature when:
-
You're solo and every customer is a face you know
-
Your volume is low enough that you catch every problem in real time
-
You haven't yet nailed the basics of scoping and quoting a ticket
One hard rule: don't try to map or measure a journey you're not recording. Shops without a reliable ticketing system first need to get their tickets clean. You can't instrument what you haven't documented.
A real scenario
A two-mechanic shop doing somewhere around 45–55 service tickets a week was stuck at a 3.9 Google rating and couldn't figure out why — the work was genuinely good. When they mapped the journey, the problem was obvious in hindsight: almost every complaint traced back to the service-to-pickup handoff. Scope grew during the repair, nobody updated the customer, and the bad news hit at the counter.
They ran the roadmap above over a quarter. Tightened booking scope, added a "we opened your bike, here's what we found" text at a fixed trigger, and standardized the checkout conversation. No new staff. No new tools.
Over the following months, surprise charges dropped noticeably, the compensation triggers they were firing fell by more than half, and the review rating climbed into the mid-4s. The number that surprised the owner most wasn't the rating — it was that repeat booking rate crept up, because customers who used to feel ambushed now felt informed. Retention moved without a single marketing dollar spent.
Bringing it together
The reason customer experience feels so slippery in a bike shop is that it's not one thing — it's a chain of handoffs, and the weakest link decides how the whole ride feels. A journey map makes that chain visible. SLA-to-compensation linkages make your promises measurable. Recovery playbooks make your response consistent under pressure. And an experiment roadmap connects the changes you make to the numbers you actually care about — conversion, retention, and lifetime value.
You don't need to build all of it in a weekend. Pick the stage that's leaking the most, instrument it, run one experiment, and measure the lift. Then move to the next stage. The shops that win at experience aren't the ones with the most polished process documents — they're the ones who treated the customer journey as a system they could measure and improve, one handoff at a time.
The reason customer experience feels so slippery in a bike shop is that it's not one thing — it's a chain of handoffs, and the weakest link decides how the whole ride feels. A journey map makes that chain visible. SLA-to-compensation linkages make your promises measurable. Recovery playbooks make your response consistent under pressure. And an experiment roadmap connects the changes you make to the numbers you actually care about — conversion, retention, and lifetime value.
You don't need to build all of it in a weekend. Pick the stage that's leaking the most, instrument it, run one experiment, and measure the lift. Then move to the next stage. The shops that win at experience aren't the ones with the most polished process documents — they're the ones who treated the customer journey as a system they could measure and improve, one handoff at a time.
Ready to revolutionize your bike shop operations?
Join hundreds of bike shops using Bicyclly to save time, increase revenue, and deliver exceptional customer service.