



Most bike shops run two mental models that never talk to each other. One is the retail-and-service brain: gross margins, labor rates, attach rates, what a tune-up actually costs to deliver. The other is the growth brain: ads, local events, sponsorships, the occasional Google campaign, the money you throw at getting people through the door. Those two almost never sit at the same table — which is exactly why so many shops spend into a customer relationship that will never pay back, or starve a channel that would've printed money if they'd fed it one more quarter.
The fix isn't a bigger spreadsheet. It's a single operating model where every dollar spent to acquire a customer gets judged against the actual margin that customer produces over their life with your shop — and where that judgment is season-aware, because a customer acquired in March behaves nothing like one acquired in November. That's what bike shop LTV CAC work is really about: not a vanity ratio, but a decision engine that tells you when to hire, when to buy, and when to pull back.
This post stitches your margin math, your seasonal cash planning, and your acquisition spend into one place an owner can actually read.
Why the two brains stay separate (and what it costs)
The separation happens for a boring structural reason: the data lives in different systems and gets reviewed on different calendars. Ad spend shows up in a marketing dashboard weekly. Service margin shows up in your P&L monthly, if you're lucky. Membership churn barely gets tracked at all. Nobody is deliberately ignoring the connection — it's just structurally invisible.
Here's the pattern that shows up in shop after shop. An owner runs a "$99 first-year tune-up club" promo, spends a few thousand pushing it locally, signs up 60 people, and feels great about the launch. What nobody calculates is that those 60 members were mostly existing customers who would've paid full price anyway, that the acquisition cost per genuinely new rider was closer to $180, and that the average new member only comes back 1.4 times before drifting off. The promo looks like a win in the signup column and a slow leak in the P&L.
The cost of keeping the brains separate isn't one bad campaign. It's the compounding of small misjudgments: overpaying for low-value customers, underinvesting in channels that bring in high-ticket buyers, and making hiring decisions based on how busy the bays feel rather than what the incoming customer economics can actually support.
The core worksheet: LTV and CAC for a ticket-driven shop
A bike shop isn't a subscription business, so borrowing SaaS LTV formulas wholesale gets you nonsense. Your customers show up on tickets — a repair here, a bike there, an accessory add-on, maybe a membership. LTV has to be built from ticket behavior, not a monthly recurring number.
Never miss a sale or service appointment again.
Bicyclly helps you manage every sale, repair, and booking with ease and accuracy.
- Unified inventory and sales tracking
- Automated customer notifications
- Service appointment scheduling
No credit card required
Here's the version that actually works for a shop:
Customer LTV = (Average contribution margin per visit) × (Visits per year) × (Expected years retained)
Contribution margin per visit is the number that matters — not revenue. If your average service ticket is $95 and the true cost to deliver it (parts, mechanic labor, a share of shop overhead) is $58, your contribution is $37. Retail tickets carry their own margin. Blend them by how a typical customer actually spends.
CAC = (Total spend to acquire, over a period) ÷ (Net new customers from that spend)
The word doing the heavy lifting is net new. Spend that reactivates a lapsed customer or discounts a loyal one is retention or margin spend, not acquisition. Mixing them is the single most common error, and it makes CAC look artificially cheap.
Below is a simple workflow visualization of the LTV and CAC calculation process.
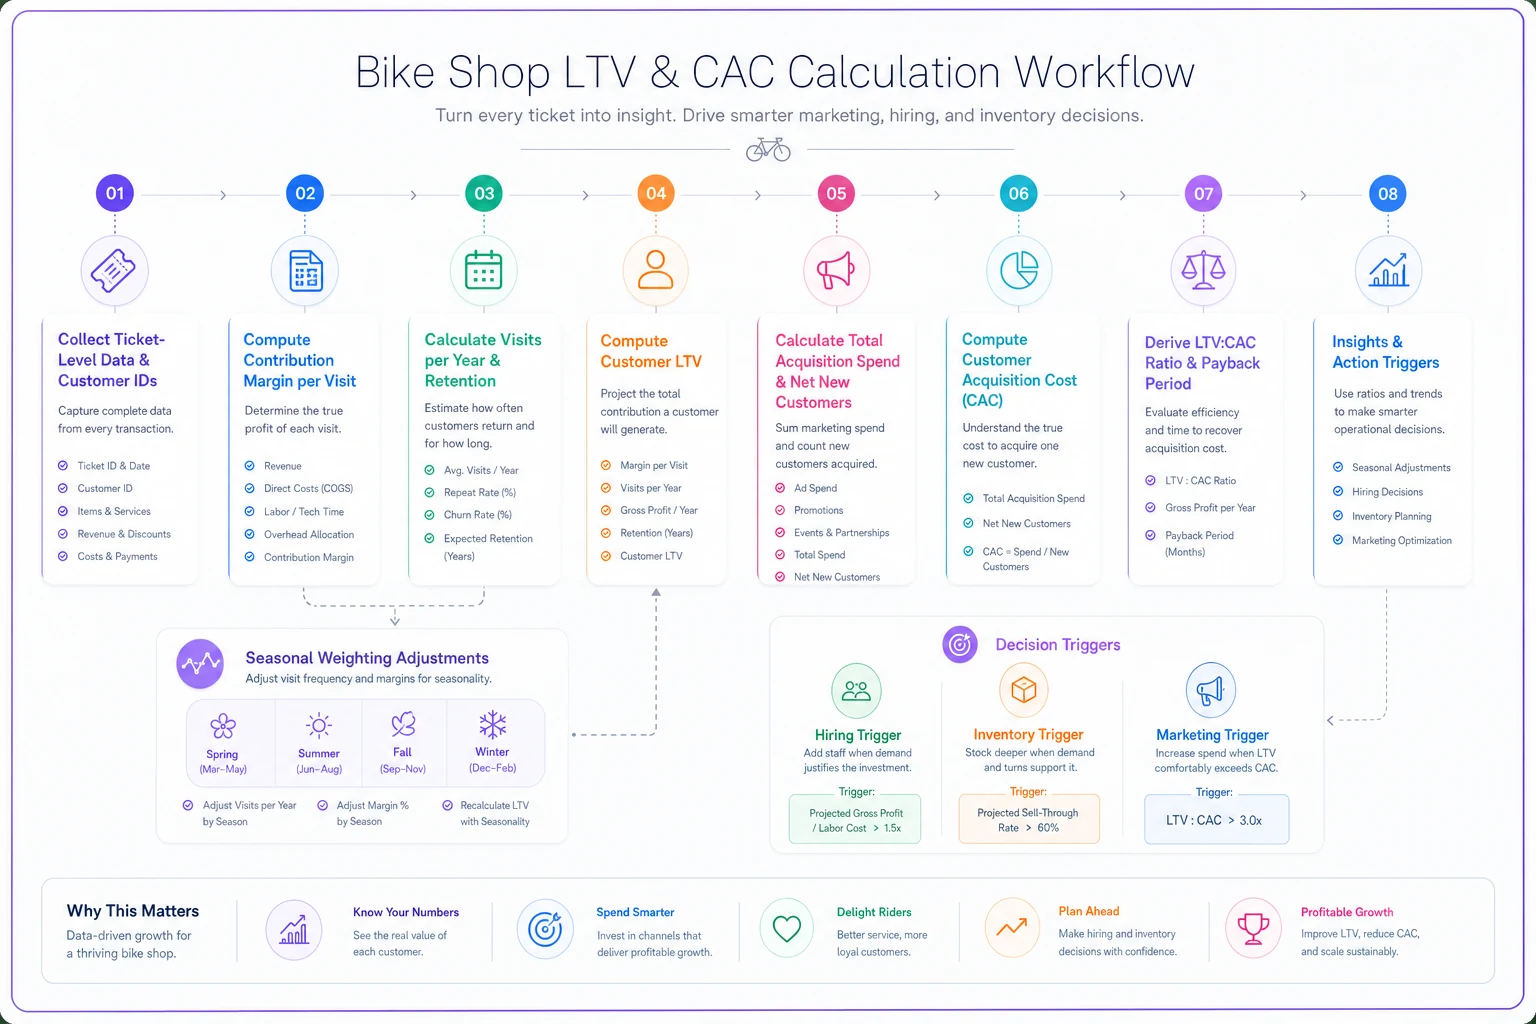
Once you have both, the ratio and the payback period become the two numbers you steer by. LTV:CAC tells you whether the relationship is worth pursuing at all. Payback period — how many months until the contribution margin covers the acquisition cost — tells you whether your cash can survive the pursuit. Those are different questions, and shops that only track the ratio get blindsided by the cash one.
If you haven't nailed down your per-visit contribution yet, that's the prerequisite. The margin and contribution model for bike shops is where the LTV side of this equation gets its inputs.
Three worked examples
Numbers make this concrete. These are illustrative, but built the way real shop math plays out.
Example 1: The service-first walk-in
A rider finds you through Google, brings in a bike for a $110 tune-up. Contribution on that first ticket is roughly $45 after parts and labor. Say you spent about $28 in ad cost to land them (net of the reactivations in that campaign). Over the next three years they come back for service about twice a year and buy a couple of accessories, adding maybe $80–$95 of contribution annually.
-
First-visit contribution
~$45
-
Annual contribution thereafter
~$85
-
Retained
~3 years
-
LTV ≈ $45 + ($85 × 2.5 remaining years) ≈ $255
-
CAC ≈ $28
-
LTV
CAC ≈ 9:1
, payback inside the first visit
That's a channel you feed aggressively. The payback is immediate, so cash isn't at risk.
Example 2: The membership member
Your service membership runs $220/year. It includes two tune-ups and priority booking. The included services cost you roughly $115 to deliver, so the plan itself contributes about $105 — before the incremental parts and accessory attach that members tend to buy, which historically adds another $60–$90 a year.
-
Annual contribution
~$180 (plan + attach)
-
Retained
~2.3 years
-
LTV ≈ $415
-
CAC ≈ $70
-
LTV
CAC ≈ 6:1
, payback around 5 months
Healthy — but notice the payback stretches past the first visit. That five-month gap is a cash consideration, especially if you sign 40 members in a single spring push. Membership economics deserve their own scrutiny; the failure modes are covered in depth in the work on designing service bundles and recurring plans that don't lose money.
Example 3: The clinic-to-customer funnel
You run a paid maintenance clinic — $40 a seat, 12 seats. The clinic roughly breaks even once you count the instructor's time. Its real job is acquisition. If a third of attendees become service customers over the following year, four new customers came out of a clinic that cost you nothing net.
-
Net CAC from the clinic
~$0 (it self-funds)
-
Each converted attendee behaves like Example 1
LTV ~$255
That's the most efficient acquisition a shop has, and almost nobody models it as acquisition. They file clinics under "community" and never connect the dots. When you actually connect them, clinic scheduling becomes a growth lever, not a hobby.
Comparing the channels side by side
Laying acquisition sources next to each other is where the model earns its keep. The same $500 spent in two different places produces wildly different outcomes depending on the customer each source delivers.
| Channel | Typical CAC | First-visit contribution | Est. LTV | LTV:CAC | Payback |
|---|---|---|---|---|---|
| Google / local search | $25–$35 | ~$45 | ~$255 | ~8–9:1 | Immediate |
| Membership push | $60–$80 | ~$105 (plan) | ~$415 | ~6:1 | ~5 months |
| Paid clinics | ~$0 net | breakeven | ~$255 | very high | Immediate |
| Broad social ads | $45–$90 | ~$30 | ~$140 | ~2–3:1 | 4–9 months |
| Deep discount promos | $120–$180 | often negative | ~$110 | <1:1 | rarely |
The bottom two rows are where shops quietly bleed. Broad social and deep discounts feel like growth because they produce traffic, but the customers they attract carry thin margins and short retention. A 2:1 ratio isn't automatically disqualifying — but at scale, with a 4–9 month payback, it ties up cash you may need for inventory at exactly the wrong time of year.
Payback thresholds tied to cash and hiring
Most LTV:CAC advice falls apart for real shops because it treats the ratio as the whole answer. For a business with brutal seasonality and inventory that eats cash months before it sells, the payback period often matters more than the ratio itself.
-
Payback under 30 days → spend freely, even in tight months. The customer pays for themselves on the first ticket.
-
Payback 1–3 months → spend normally in-season; throttle back in your low-cash months.
-
Payback 3–6 months → only spend when you have cash runway to cover the gap across your slow period. This is where a spring signing spree can quietly create a summer cash squeeze.
-
Payback over 6 months → treat as an investment decision, not a marketing decision. Requires deliberate cash planning.
-
Hiring trigger when your trailing 60-day net new customer count and their projected LTV supports the added labor cost with margin to spare — not when the bays feel slammed. A shop that hires off vibes in June is the same shop laying off in October.
-
Inventory trigger when acquisition is bringing in a customer mix skewed toward bike buyers, lean purchasing toward stock and accessories that mix attaches. When the mix skews service-only, weight toward parts and consumables.
This is where acquisition economics and seasonal cash planning have to merge. A payback that's fine in April can be dangerous heading into your slow quarter. The mechanics of matching outflows to your revenue calendar live in the 6-month rolling cash-flow plan for purchases and staffing, and the acquisition thresholds above should plug straight into it.
The seasonality layer everyone skips
A customer acquired in your peak isn't worth the same as one acquired in your trough — even at identical CAC. Peak-acquired customers often churn faster because they came in for one urgent seasonal need. Off-season customers, oddly, tend to retain better. Someone getting a mid-winter overhaul is telling you they ride year-round.
The practical move is to season-weight your LTV. Track retention by acquisition month, not just overall. A shop that does this usually finds two or three months where acquisition spend produces genuinely durable customers, and a peak stretch where the spend just pulls forward demand that would've arrived anyway.
That insight changes budget timing entirely. Instead of dumping ad money into your busiest months — when you're demand-constrained, not demand-starved — you shift spend into shoulder seasons where a new customer pays back fast and sticks. Your inventory forecasting has to move in step with that, and the ticket-driven seasonal forecasting playbook pairs naturally with a season-weighted acquisition budget.
The monthly decision checklist
The whole model collapses into a review you run once a month. Keep it boring and repeatable:
-
[ ] Pull net new customers by channel (strip out reactivations and discounted regulars)
-
[ ] Update CAC per channel for the trailing period
-
[ ] Recalculate blended per-visit contribution from actual tickets
-
[ ] Refresh LTV using current retention and visit-frequency numbers
-
[ ] Flag any channel where LTV
CAC dropped below 3:1
-
[ ] Check payback against your current cash position for the next 90 days
-
[ ] Review hiring trigger
does trailing net-new LTV support current or added labor?
-
[ ] Review inventory trigger
what's the incoming customer mix telling purchasing to do?
-
[ ] Note season-weighted retention — are this month's acquisitions the durable kind?
-
[ ] Decide one thing to scale, one thing to cut
Prioritize automating the net-new calculation by syncing customer IDs between your POS and marketing sources so the checklist becomes ten minutes, not ten spreadsheets.
Ten minutes if your data is clean. The clean-data part is the catch — most shops can't separate net-new from reactivation because the POS and the marketing spend never get reconciled. Getting those two data sources to line up, so acquisition cost and customer margin sit in one view, is the difference between a model you run monthly and a spreadsheet you abandon by summer. A shop management platform that ties ticket history to customer records does most of that reconciliation quietly in the background, which is really the only reason a busy owner sticks with the routine at all.
A real scenario
A single-location shop doing roughly $900k a year had been running a standing "spring saver" discount and boosting social posts most weeks — call it $2,800–$3,200 a month in acquisition-ish spend. Signups looked strong. The books didn't.
When they finally separated net-new from reactivation, the picture flipped. The discount promo was acquiring almost nobody new — it was mostly loyal customers taking money off tickets they'd have paid full price for, effectively a negative contribution on that "acquisition." The boosted social was landing customers at a CAC around $70 with a payback near seven months, right into the shop's cash-tight late summer.
They cut both, redirected about half the budget into local search and two paid clinics per quarter, and moved the remaining spend from peak months into shoulder weeks. Net new customers barely moved in count — but the quality did. Blended payback dropped to under a month for the majority of new customers, the summer cash squeeze eased, and they hired their next mechanic off actual trailing LTV instead of a busy-bay gut feeling. No revenue miracle. Just money spent where it came back.
When this model is worth building — and when it isn't
Build it if: you're spending real money on acquisition, running memberships or clinics, or feeling seasonal cash swings that make hiring and buying feel like guesswork. The model turns those guesses into thresholds.
Skip the heavy version if: you're a one-person shop running almost entirely on word of mouth with no paid acquisition. Track your contribution margin, watch retention informally, and revisit this when you start spending to grow.
Don't build it if you're going to run the worksheet once and never touch it again. A stale LTV:CAC number is worse than none — it gives you false confidence to spend into a channel that quietly went underwater two seasons ago.
The point of tying acquisition economics to service margins and seasonal cash isn't precision for its own sake. It's so the two brains — the one that spends to grow and the one that watches margin — finally make decisions off the same page, in the same month, against the same cash reality. That's when growth stops feeling like a gamble and starts feeling like a schedule.
Ready to revolutionize your bike shop operations?
Join hundreds of bike shops using Bicyclly to save time, increase revenue, and deliver exceptional customer service.